Getting Started with Media Forking for Webex Contact Center
Note: This guide uses
<REPO_ROOT>to represent the directory where you cloned the repository. Replace this with your actual path (e.g.,/home/user/projectsorC:\Users\username\projects).
Feature: Real-Time Media Streaming for Customer-Agent Conversations
Last Updated: March 04, 2026
Audience: Developers and Partners
Table of Contents
- Overview
- What is Media Forking?
- Use Cases
- Architecture
- Load Balancer Support
- Prerequisites
- Quick Start: Running the Simulator
- Step-by-Step Setup Guide
- Testing Your Integration
- Troubleshooting
- Next Steps
- Support & Resources
Overview
Media Forking is a premium feature of Webex Contact Center (WXCC) that enables third-party partners and developers to receive real-time audio streams from customer-agent conversations. This powerful capability allows you to build AI-driven solutions for sentiment analysis, real-time transcription, agent assistance, quality monitoring, and more.
Key Benefits
- Real-Time Access: Receive audio streams as the conversation happens
- Dual-Channel Audio: Separate streams for customer and agent audio
- Flexible Use Cases: Recording, transcription, sentiment analysis, agent coaching, compliance monitoring
- Secure Integration: gRPC-based protocol with authentication and encryption
- Scalable: Designed to handle high-volume contact center operations
What is Media Forking?
Media Forking allows you to “tap into” live customer-agent voice conversations in a Webex Contact Center deployment. Here’s how it works:
The Customer Journey
- Inbound Call: A customer calls your contact center
- IVR Interaction: The call is routed to an IVR (Interactive Voice Response) system for self-service
Note: WXCC also offers BYOVA (Bring Your Own Virtual Agent), another gRPC-based solution that allows integration with custom virtual agents at this step of the journey
- Agent Escalation: If the IVR cannot resolve the issue, the customer requests to speak with an agent
- Media Forking Trigger: When the customer connects to an agent, the media forking activity in the flow is triggered
- Real-Time Streaming: Audio from both the customer and agent is streamed to your registered data source endpoint
Important Notes
- Media forking is only triggered when a customer connects to a live agent
- It does not capture IVR interactions or pre-agent audio
- This is a paid feature that must be enabled through Cisco’s CCW (Commerce Workspace) ordering tool
Development Note: Trial access during development is available but requires custom enablement by the WXCC team
- Audio is streamed in real-time with minimal latency
What You Receive
Media forking provides two separate audio channels:
- Channel 1: Customer audio (what the customer is saying)
- Channel 2: Agent audio (what the agent is saying, or what the customer hears)
This dual-channel approach enables sophisticated analysis and processing of the conversation.
Use Cases
Media Forking enables a wide range of AI-powered contact center solutions:
1. Real-Time Transcription
Convert speech to text in real-time, providing agents with a written record of the conversation as it happens.
2. Sentiment Analysis
Analyze customer emotions and sentiment during the call to help agents adjust their approach or escalate issues.
3. Agent Assistance & Coaching
- Provide real-time suggestions to agents based on conversation context
- Identify knowledge base articles or scripts that can help resolve the issue
- Detect compliance violations or script deviations
4. Quality Monitoring
- Automatically flag calls for quality review based on keywords, sentiment, or compliance criteria
- Generate quality scores in real-time
5. Conversation Intelligence
- Extract key insights from conversations (customer intent, pain points, product mentions)
6. Voice Biometrics & Voice Printing
- Authenticate customers through their unique voice patterns
- Create voice prints for fraud detection and prevention
- Reduce authentication time by identifying returning callers
- Enhance security with passive, non-intrusive authentication
7. Compliance & Recording
- Record conversations for regulatory compliance
- Detect sensitive information (PCI, PII) and trigger security protocols
- Maintain audit trails
Architecture
High-Level Architecture
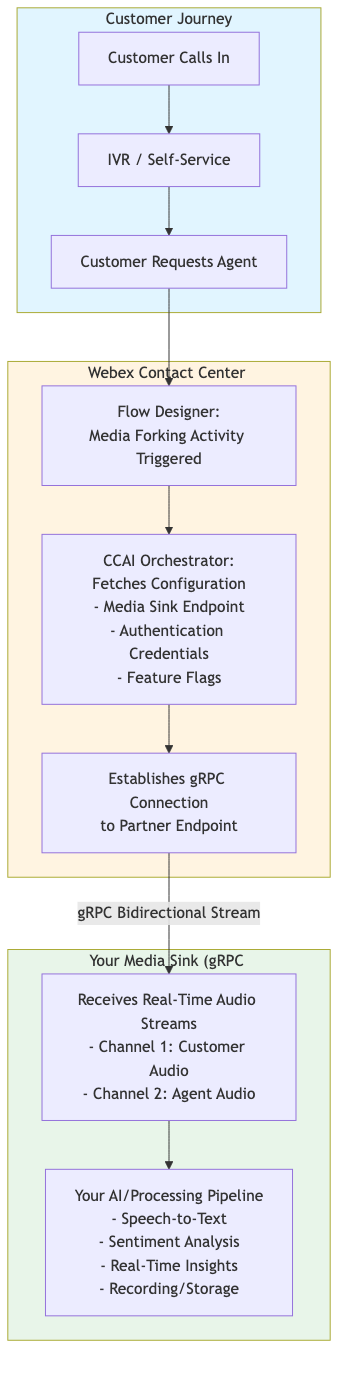
The architecture consists of three main components:
- Customer Journey (Blue): Customer calls in, interacts with IVR, and requests to speak with an agent
- Webex Contact Center (Yellow): Flow Designer triggers media forking, CCAI Orchestrator fetches configuration and establishes gRPC connection
- Your Media Sink (Green): Your gRPC server receives real-time audio streams and processes them through your AI pipeline
Component Breakdown
1. Service App (Partner Setup)
- Partners create a Service App in the Webex Developer Portal
- Service App includes:
- Data source schema: Media forking schema (wraps the protobuf)
- Data exchange domain: Your gRPC endpoint URL
- Required scopes:
spark-admin:dataSource_readandspark-admin:dataSource_write
- Service App is submitted for customer authorization
2. Admin Authorization (Customer Organization)
- Customer admin authorizes the Service App in Control Hub
- Admin reviews:
- Partner and developer information
- Data destination URL (where media will be sent)
- Schema (what data is being sent)
- Upon authorization:
- Service App becomes selectable in Flow Designer for media forking
- Partner can retrieve organization-specific access and refresh tokens
3. Data Source Registration (Partner Action)
- Partner uses the organization-specific access token to register a data source
- Note: For media forking, this is actually a data sink (destination for media). The “data source” API is generic and used for multiple use cases.
- Data source registration includes:
- URL: Where media will be sent (must match or be subdomain/path of Service App URL)
- Authentication info: How JWS token should be constructed (nonce, expiration, public key)
- Each customer organization has its own data source for independent management
4. Flow Designer (WXCC Admin)
- Contact center administrators create call flows using the Flow Designer
- A Media Forking Activity is added to the flow at the point where agent connection occurs
- Admin selects the authorized Service App (not a CCAI Configuration)
5. CCAI Orchestrator (Runtime - WXCC Platform)
- When media forking is triggered during a call:
- Orchestrator receives the media stream
- Uses the organization ID to lookup the registered data source URL
- Retrieves authentication details for JWS token construction
- Establishes gRPC connection to the partner’s endpoint
- Authenticates using the JWS token
- Streams audio in real-time to the partner
6. Your Media Sink (Partner gRPC Server)
- Validates the JWS token
- Receives bidirectional streaming audio
- Processes audio according to your use case
- Token Management:
- OAuth Tokens (Access/Refresh): Standard Webex expiration (14 days for access, 90 days for refresh). Refresh as needed for data source management.
- JWS Token (Runtime): Update data source with new nonce and expiration between every 1 hour (minimum) and 24 hours (maximum) so WXCC can generate fresh JWS tokens
Load Balancer Support
Overview
When deploying Media Forking in production, you’ll likely need to use a load balancer for high availability and scalability. This section explains how Webex Orchestrator supports load balancer routing through HTTP/2 headers.
Understanding the Stream Architecture
For each call, Webex Orchestrator establishes two separate gRPC connections to your endpoint:
- Connection 1: Agent audio stream (
role=AGENT) - Connection 2: Customer audio stream (
role=CALLER)
These are separate HTTP/2 streams at the network level. While both connections include the conversation_id in the protobuf message body, load balancers cannot inspect protobuf data (it’s binary and opaque).
The x-conversation-id HTTP/2 Header
To enable load balancer routing, Webex Orchestrator includes the conversation_id as an HTTP/2 header on all Media Forking connections:
Header Name: x-conversation-id
Header Value: The conversation ID (UUID format)
Present On: Both agent and customer gRPC streams for the same call
Important: gRPC Metadata = HTTP/2 Headers
gRPC metadata headers ARE HTTP/2 headers. gRPC is built on top of HTTP/2, so when Orchestrator adds gRPC metadata, it appears as a standard HTTP/2 header that load balancers can see and route on.
What your load balancer sees:
HEADERS frame:
  :method: POST
  :scheme: https
  :path: /com.cisco.wcc.ccai.media.v1.ConversationAudio/StreamConversationAudio
  :authority: your-endpoint.com:50051
  content-type: application/grpc
  x-conversation-id: 550e8400-e29b-41d4-a716-446655440000  ← Standard HTTP/2 header
  authorization: Bearer <JWS_TOKEN>
How This Enables Load Balancing
With the x-conversation-id header, you can configure your load balancer to use consistent hashing to ensure both agent and customer streams for the same call route to the same backend server:
- Load balancer receives connection from Orchestrator
- Reads
x-conversation-idheader (standard HTTP/2 header) - Hashes the conversation ID to select a backend server
- Routes the connection to that server
- Both streams with same conversation ID → same backend server
Load Balancer Configuration Examples
Important: The simulator now runs two separate servers:
- Main Server (Port 8086): TLS-protected, for audio services
- Health Check Server (Port 8080): Plaintext, no certificate required
Configure your load balancer to:
- Route audio traffic to port 8086 (TLS)
- Perform health checks on port 8080 (plaintext, no certificate hassle)
NGINX
upstream media_forking_backends {
    # Use consistent hashing on x-conversation-id header
    hash $http_x_conversation_id consistent;

    server backend1.example.com:8086 max_fails=3 fail_timeout=30s;
    server backend2.example.com:8086 max_fails=3 fail_timeout=30s;
    server backend3.example.com:8086 max_fails=3 fail_timeout=30s;
}

upstream media_forking_health {
    # Health check backends (plaintext, port 8080)
    server backend1.example.com:8080;
    server backend2.example.com:8080;
    server backend3.example.com:8080;
}

server {
    listen 443 ssl http2;
    server_name media-forking.example.com;

    ssl_certificate /path/to/cert.pem;
    ssl_certificate_key /path/to/key.pem;

    # Main audio services (port 8086, TLS)
    location / {
        grpc_pass grpcs://media_forking_backends;
        grpc_read_timeout 3600s;
        grpc_send_timeout 3600s;
    }
}

# Separate health check endpoint (plaintext, port 8080)
server {
    listen 8080;
    server_name media-forking.example.com;

    location / {
        grpc_pass grpc://media_forking_health;
    }
}
HAProxy
# Main audio service frontend (TLS, port 443)
frontend grpc_frontend
    bind *:443 ssl crt /path/to/cert.pem alpn h2
    mode http
    default_backend grpc_backend

# Health check frontend (plaintext, port 8080)
frontend health_frontend
    bind *:8080
    mode http
    default_backend health_backend

# Main backend (port 8086, TLS)
backend grpc_backend
    mode http

    # Balance based on x-conversation-id header with consistent hashing
    balance hdr(x-conversation-id)
    hash-type consistent

    # Backend servers - health checks on port 8080 (plaintext)
    server backend1 backend1.example.com:8086 check port 8080
    server backend2 backend2.example.com:8086 check port 8080
    server backend3 backend3.example.com:8086 check port 8080

    # Timeouts for long-lived connections
    timeout connect 5s
    timeout client 3600s
    timeout server 3600s

# Health check backend (port 8080, plaintext)
backend health_backend
    mode http
    server backend1 backend1.example.com:8080 check
    server backend2 backend2.example.com:8080 check
    server backend3 backend3.example.com:8080 check
Envoy Proxy
static_resources:
  listeners:
  - name: listener_0
    address:
      socket_address:
        address: 0.0.0.0
        port_value: 443
    filter_chains:
    - filters:
      - name: envoy.filters.network.http_connection_manager
        typed_config:
          "@type": type.googleapis.com/envoy.extensions.filters.network.http_connection_manager.v3.HttpConnectionManager
          stat_prefix: ingress_http
          codec_type: AUTO
          route_config:
            name: local_route
            virtual_hosts:
            - name: backend
              domains: ["*"]
              routes:
              - match:
                  prefix: "/"
                  grpc: {}
                route:
                  cluster: media_forking_cluster
                  # Hash on x-conversation-id header
                  hash_policy:
                  - header:
                      header_name: x-conversation-id
          http_filters:
          - name: envoy.filters.http.router
      transport_socket:
        name: envoy.transport_sockets.tls
        typed_config:
          "@type": type.googleapis.com/envoy.extensions.transport_sockets.tls.v3.DownstreamTlsContext
          common_tls_context:
            tls_certificates:
            - certificate_chain:
                filename: /path/to/cert.pem
              private_key:
                filename: /path/to/key.pem

  clusters:
  # Main audio service cluster (port 8086, TLS)
  - name: media_forking_cluster
    connect_timeout: 5s
    type: STRICT_DNS

    # Ring hash for consistent routing
    lb_policy: RING_HASH
    ring_hash_lb_config:
      hash_function: XX_HASH
      minimum_ring_size: 1024

    # Enable HTTP/2 for gRPC
    http2_protocol_options: {}

    # Health checks on port 8080 (plaintext)
    health_checks:
    - timeout: 5s
      interval: 10s
      unhealthy_threshold: 3
      healthy_threshold: 2
      grpc_health_check:
        service_name: ""
      custom_health_check:
        name: envoy.health_checkers.http
        typed_config:
          "@type": type.googleapis.com/envoy.extensions.health_checkers.grpc.v3.HealthChecker
          transport_socket_match_criteria:
            plaintext: {}

    load_assignment:
      cluster_name: media_forking_cluster
      endpoints:
      - lb_endpoints:
        - endpoint:
            address:
              socket_address:
                address: backend1.example.com
                port_value: 8086
            health_check_config:
              port_value: 8080
        - endpoint:
            address:
              socket_address:
                address: backend2.example.com
                port_value: 8086
            health_check_config:
              port_value: 8080
        - endpoint:
            address:
              socket_address:
                address: backend3.example.com
                port_value: 8086
            health_check_config:
              port_value: 8080
AWS Application Load Balancer (ALB)
AWS ALB supports gRPC and can route based on HTTP headers:
# Create target group for main audio service (port 8086)
aws elbv2 create-target-group \
  --name media-forking-targets \
  --protocol HTTPS \
  --port 8086 \
  --vpc-id vpc-xxxxx \
  --target-type ip \
  --health-check-enabled \
  --health-check-protocol HTTP \
  --health-check-port 8080 \
  --health-check-path /grpc.health.v1.Health/Check

# Create load balancer
aws elbv2 create-load-balancer \
  --name media-forking-lb \
  --subnets subnet-xxxxx subnet-yyyyy \
  --security-groups sg-xxxxx \
  --scheme internet-facing \
  --type application

# Create listener with gRPC support
aws elbv2 create-listener \
  --load-balancer-arn arn:aws:elasticloadbalancing:... \
  --protocol HTTPS \
  --port 443 \
  --certificates CertificateArn=arn:aws:acm:... \
  --default-actions Type=forward,TargetGroupArn=arn:aws:elasticloadbalancing:...

# Enable stickiness based on header
aws elbv2 modify-target-group-attributes \
  --target-group-arn arn:aws:elasticloadbalancing:... \
  --attributes Key=stickiness.enabled,Value=true \
                Key=stickiness.type,Value=app_cookie \
                Key=stickiness.app_cookie.cookie_name,Value=x-conversation-id
Note: AWS ALB uses application-based stickiness. For true consistent hashing, consider using AWS Global Accelerator with custom routing or Envoy on EC2/ECS.
Google Cloud Load Balancer
For GCP, use Cloud Load Balancing with session affinity:
# Create health check on port 8080 (plaintext)
gcloud compute health-checks create http grpc-health-check \
  --port=8080 \
  --request-path=/grpc.health.v1.Health/Check

# Create backend service with session affinity (port 8086)
gcloud compute backend-services create media-forking-backend \
  --global \
  --protocol=HTTP2 \
  --port-name=grpc \
  --health-checks=grpc-health-check \
  --session-affinity=HEADER_FIELD \
  --custom-request-header="x-conversation-id"

# Add backend instances
gcloud compute backend-services add-backend media-forking-backend \
  --global \
  --instance-group=media-forking-ig \
  --instance-group-zone=us-central1-a \
  --balancing-mode=UTILIZATION \
  --max-utilization=0.8
Note: Configure your instance group to expose port 8086 for audio traffic and port 8080 for health checks.
Verification
After configuring your load balancer, verify that both streams route to the same backend:
Test with Multiple Backends
- Deploy 3 backend servers with unique identifiers
- Make a test call through your Media Forking setup
- Check logs on all backends to see which received the streams
- Verify: Both agent and customer streams should appear on the same backend
Log Example
Backend 1 logs:
INFO: Connection received - conversation_id: 550e8400-e29b-41d4-a716-446655440000, role: AGENT
INFO: Connection received - conversation_id: 550e8400-e29b-41d4-a716-446655440000, role: CALLER
Backend 2 logs:
(no connections for this conversation_id)
Backend 3 logs:
(no connections for this conversation_id)
Monitor Header Presence
Use packet capture to verify the header is present:
# Capture traffic on load balancer
sudo tcpdump -i any -s 0 -w capture.pcap 'port 443'

# Analyze with tshark
tshark -r capture.pcap -Y "http2.header.name == \"x-conversation-id\"" -T fields -e http2.header.value
Best Practices
- Use Consistent Hashing: Ensures same conversation always routes to same backend
- Configure Health Checks: Use the gRPC health check endpoint
- Set Appropriate Timeouts: Calls can last 30+ minutes, set timeouts accordingly
- Monitor Distribution: Ensure conversations are evenly distributed across backends
- Plan for Failover: Configure backup backends and graceful degradation
- Test Thoroughly: Verify routing with multiple concurrent calls
Troubleshooting Load Balancer Issues
Both Streams Not Reaching Same Backend
Symptoms:
- Agent audio on Backend 1, customer audio on Backend 2
- Cannot correlate streams for the same call
Solutions:
- Verify load balancer is configured for consistent hashing on
x-conversation-id - Check that header name matches exactly (case-sensitive)
- Ensure hash algorithm is consistent (not random or round-robin)
- Test with packet capture to confirm header is present
Uneven Load Distribution
Symptoms:
- One backend receives most calls
- Other backends idle
Solutions:
- Increase ring size for better distribution (Envoy:
minimum_ring_size) - Verify hash function is distributing evenly
- Check backend health - unhealthy backends won’t receive traffic
- Monitor conversation ID distribution (should be random UUIDs)
Prerequisites
Before you begin, ensure you have:
1. Licensing & Provisioning
For Customer Organizations:
- Media Forking Subscription: Purchased through a Cisco partner
- How it works: Customers work with their Cisco partner to order media forking subscriptions
- Subscription Model: Licensed in bundles of 2,000 minutes per month
- Usage: Minutes are counted from when media forking starts until the end of the call
- Note: The partner providing the media forking service can assist with ordering, or customers can work with their existing Cisco partner
- License Applied: Feature enabled for your WXCC organization by Cisco
- Admin Access: Full administrator access to Webex Control Hub
For Partners/Developers:
- Development/Testing: Use a Webex sandbox or your own licensed WXCC organization for development and testing
- Trial Access: During EA phase or development, partners can request a trial environment instead of purchasing production licenses
- Customer Licensing: Your customers will need their own media forking subscriptions ordered through a Cisco partner
2. Technical Requirements
- gRPC Server: Ability to host a gRPC server accessible from the internet
- TLS/SSL Certificate (MANDATORY): Valid CA-signed certificate for secure gRPC connections
- Security Requirement: TLS 1.2 or higher is required for all deployments
- Certificate Requirement: Must be signed by a trusted Certificate Authority (CA)
- Self-signed certificates are NOT supported - Webex Orchestrator will reject connections with self-signed certificates
- Without TLS, authentication tokens and audio data are transmitted in plaintext
- Recommended CAs: Let’s Encrypt (free), DigiCert, Sectigo, GlobalSign
- Public Endpoint: Your gRPC server must be reachable from WXCC (public IP or domain)
- Firewall Rules: Appropriate firewall rules to allow incoming gRPC connections
3. Development Environment
For Sample Simulator
The following requirements apply only if you plan to build and run the provided sample simulator:
- Java 17 (Required for simulator)
- Critical: The simulator requires Java 17 for both building and running
- Maven must use Java 17 even if newer versions are installed
- IMPORTANT: Maven might use a different Java version than your system default
- To ensure Maven uses Java 17:
export JAVA_HOME=$(/usr/libexec/java_home -v 17) - Verify Maven’s Java with:
mvn -version(should report using Java 17, not Java 25+) - The project is compiled to Java 17 bytecode (maven.compiler.source/target=17)
- Lombok 1.18.32 and other dependencies support Java 17-22
- Maven (for building the simulator)
- Git (for cloning the sample code repository)
- Docker (optional, for containerized deployment)
For Custom Implementation
If you’re building your own gRPC server implementation from scratch:
- Any Programming Language: You can implement a gRPC server in any language with gRPC support (Java, C#, Go, Node.js, Python, etc.)
- gRPC Framework: Must support gRPC protocol buffers v3
- JWT Validation Library: For validating JWS tokens from WXCC
- Audio Processing Library: For your specific audio processing needs
4. Audio Processing Capabilities
- Supported Audio Format: WAV
- Sampling Rate: 8kHz or 16kHz
- Encoding: Linear16 or μ-law (ulaw)
- Channels: Single channel per stream (customer and agent are separate streams)
5. Knowledge Prerequisites
- Basic understanding of gRPC and Protocol Buffers
- Familiarity with Webex Contact Center concepts (flows, entry points, routing)
- Experience with audio processing (if building custom solutions)
Quick Start: Running the Simulator
The fastest way to validate your setup and understand media forking is to run the provided simulator. This section gets you up and running in under 30 minutes.
What is the Simulator?
The Dialog Connector Simulator is a sample gRPC server that:
- Implements the media forking protocol
- Receives audio streams from WXCC
- Logs received audio for inspection
- Responds with simple acknowledgments
- Helps you validate your configuration before building your production solution
Step 1: Clone the Sample Code
Important: This guide uses an enhanced fork of the simulator with additional features including environment variable support for DATASOURCE_URL, improved audio storage, and updated authentication. These enhancements are pending merge to the official repository.
# Clone the enhanced repository
git clone https://github.com/ralfschiffert/webex-contact-center-provider-sample-code.git

# Navigate to the simulator directory
cd webex-contact-center-provider-sample-code/media-service-api/dialog-connector-simulator
What’s Enhanced in This Fork:
- Environment variable support for
DATASOURCE_URL(critical for Cloud Run deployments) - Updated Media Forking schema UUID
- Improved audio file storage to Google Cloud Storage
- Enhanced health check implementation
- PORT configuration flexibility
- Complete documentation and deployment guides
Note: Once these changes are merged into the official CiscoDevNet repository, you can clone from there instead.
Step 2: Understand the Project Structure
Before building, familiarize yourself with the project layout:
dialog-connector-simulator/
├── pom.xml                          # Maven build configuration
├── Dockerfile                       # Container image definition
├── src/
│   └── main/
│       ├── java/com/cisco/wccai/
│       │   └── grpc/
│       │       ├── server/          # gRPC server implementation
│       │       │   ├── GrpcServer.java                    # Main server entry point
│       │       │   ├── ConversationAudioForkServiceImpl.java  # Media forking service
│       │       │   ├── HealthServiceImpl.java             # Health check service
│       │       │   └── interceptors/                      # Authentication interceptors
│       │       ├── client/          # gRPC client (for testing)
│       │       ├── config/          # Configuration management
│       │       └── model/           # Data models
│       ├── proto/com/cisco/wcc/ccai/v1/
│       │   ├── ccai-api.proto                   # Main API definitions
│       │   ├── conversationaudioforking.proto   # Media forking protocol
│       │   └── common/                          # Shared protocol definitions
│       │       ├── health.proto
│       │       ├── media_service_common.proto
│       │       └── virtualagent.proto
│       └── resources/               # Configuration files
├── test-health.sh                   # Health check test script
└── .idea/                           # IntelliJ IDEA project files
Key Components:
- GrpcServer.java: Main entry point that starts the gRPC server on port 8086
- ConversationAudioForkServiceImpl.java: Implements media forking protocol, receives audio streams
- conversationaudioforking.proto: Protocol buffer definition for media forking API
- Dockerfile: Builds container image using Google Cloud SDK base image
Step 3: Build the Simulator
# Ensure Maven uses Java 17 (critical for Apple Silicon/ARM Macs)
export JAVA_HOME=$(/usr/libexec/java_home -v 17)

mvn clean compile

# Build the application
mvn clean install
Expected Output:
[INFO] ------------------------------------------------------------------------
[INFO] BUILD SUCCESS
[INFO] ------------------------------------------------------------------------
[INFO] Total time:  4.471 s
[INFO] Finished at: 2026-01-29T19:55:14-08:00
[INFO] ------------------------------------------------------------------------
What happens during build:
- Protocol Buffer files (
.proto) are compiled to Java classes - Generated classes are placed in
target/generated-sources/protobuf/ - Maven Shade plugin creates an “all-in-one” JAR:
dialog-connector-simulator-1.0.0-SNAPSHOT-allinone.jar - This JAR contains all dependencies and can be run standalone
Step 4: Configure the Simulator
The simulator uses config.properties located at src/main/resources/config.properties. Review and modify as needed:
# Endpoint to connect
API_URL=localhost

# Port (TLS - 443, NonTLS - 31400, Google Cloud - 8086)
PORT=8086

# Audio encoding supported types - LINEAR16, MULAW
AUDIO_ENCODING_TYPE=MULAW

# Datasource URL for JWT validation
DATASOURCE_URL=https://dialog-connector-simulator.intgus1.ciscoccservice.com:443
Key Configuration Options:
- PORT: 8086 (default for both local and Google Cloud)
- Can be configured via
config.propertiesfile - Can be overridden with PORT environment variable
- Configuration Priority: Environment variable > config.properties > hardcoded default (8086)
- Note: When running locally with
mvn exec:java, changes toconfig.propertiesare applied immediately. When building for deployment (Docker/JAR), configuration changes require rebuilding.
- Can be configured via
- API_URL: The endpoint hostname to connect to (default:
localhost) - AUDIO_ENCODING_TYPE: Audio encoding format for processing (options:
LINEAR16,MULAW) - DATASOURCE_URL: URL used for JWT token validation - must match the URL registered in your data source
- Can be configured via
config.propertiesfile - Can be overridden with DATASOURCE_URL environment variable
- Configuration Priority: Environment variable > config.properties > hardcoded default
- Important: This URL must exactly match the
urlfield in your data source registration (Step 5 in Webex Configuration) - For Google Cloud Run deployments, set this as an environment variable to match your Cloud Run service URL
- For local development with ngrok, set this to your ngrok URL
- Can be configured via
Step 4a: Configure TLS/SSL Encryption (REQUIRED FOR PRODUCTION)
🔒 SECURITY REQUIREMENT: TLS/SSL encryption is MANDATORY for production deployments. Without TLS, all traffic including authentication tokens and audio data is transmitted in plaintext, creating a critical security vulnerability.
The simulator runs two separate gRPC servers:
- Main Server (Port 8086): TLS-protected for audio services - REQUIRES CA-signed certificate
- Health Check Server (Port 8080): Plaintext, no certificate required - for monitoring and load balancers
You MUST configure TLS for the main server before deploying to production.
Why TLS is Required
Without TLS encryption:
- ❌ Authentication tokens (JWS) are visible in plaintext - anyone can steal and reuse them
- ❌ Customer audio data is unencrypted - conversations can be intercepted and recorded
- ❌ Man-in-the-middle attacks are possible - attackers can modify or inject data
- ❌ Compliance violations - violates PCI DSS, HIPAA, GDPR, SOC 2 requirements
- ❌ Webex security requirements not met - all external communications must use TLS 1.2+
TLS Configuration Options
The simulator supports TLS configuration via environment variables or config.properties:
Option 1: Environment Variables (Recommended for Production)
export TLS_CERT_PATH=/path/to/server.crt
export TLS_KEY_PATH=/path/to/server.key
Option 2: config.properties
Add to src/main/resources/config.properties:
# TLS/SSL Configuration
TLS_CERT_PATH=/path/to/server.crt
TLS_KEY_PATH=/path/to/server.key
Configuration Priority: Environment variable > config.properties > not configured
Health Check Port Configuration
The health check server runs on a separate port (default 8080) without TLS:
Option 1: Environment Variable
export HEALTH_PORT=8080
Option 2: config.properties
# Health Check Port (plaintext, no TLS)
HEALTH_PORT=8080
Why Separate Health Check Port?
- ✅ No certificate required for health checks
- ✅ Simpler for load balancers and monitoring tools
- ✅ No authentication required
- ✅ Main audio services remain TLS-protected on port 8086
Obtaining TLS Certificates
IMPORTANT: Webex Orchestrator does not accept self-signed certificates. You must use a certificate signed by a trusted Certificate Authority.
Option 1: Let’s Encrypt (Free, Recommended for Most Deployments)
Let’s Encrypt provides free, automated certificates that are trusted by all major platforms:
# Install certbot
sudo apt-get install certbot  # Ubuntu/Debian
brew install certbot          # macOS

# Generate certificate for your domain
sudo certbot certonly --standalone -d your-domain.com

# Certificates will be saved to:
# Certificate: /etc/letsencrypt/live/your-domain.com/fullchain.pem
# Private Key: /etc/letsencrypt/live/your-domain.com/privkey.pem

# Set up auto-renewal (certificates expire every 90 days)
sudo certbot renew --dry-run
Option 2: Commercial Certificate Authority
- Generate Certificate Signing Request (CSR):
# Generate private key openssl genrsa -out server.key 2048 # Generate CSR openssl req -new -key server.key -out server.csr \ -subj "/CN=your-domain.com/O=Your Organization/C=US" - Purchase certificate from a trusted CA (DigiCert, Sectigo, GlobalSign, etc.)
- Submit CSR to the CA for signing
- Download signed certificate and intermediate chain from CA
- Install certificate on your server
- Configure paths in environment variables or config.properties
For Google Cloud Run:
Google Cloud Run automatically provides TLS termination, so you don’t need to configure certificates manually. However, ensure your data source URL uses https://.
Server Behavior
With TLS Configured (Production):
INFO: Main server port: 8086, Health check port: 8080
INFO: ✓ Health check server started at port : 8080 (plaintext, no authentication required)
INFO: TLS enabled - Certificate: /path/to/cert.pem, Key: /path/to/key.pem
INFO: ✓ Secure gRPC server started at port : 8086 with TLS/SSL encryption
- Main server (8086): TLS-protected, authentication required
- Health check server (8080): Plaintext, no authentication
- Audio data encrypted in transit
- Production-ready security
Without TLS (Development Only):
INFO: Main server port: 8086, Health check port: 8080
INFO: ✓ Health check server started at port : 8080 (plaintext, no authentication required)
WARN: ⚠️  WARNING: TLS is NOT configured! Main server will run WITHOUT encryption.
WARN: ⚠️  This is a SECURITY RISK and should ONLY be used for local development.
INFO: server started at port : 8086 (UNENCRYPTED)
Testing TLS Configuration
After configuring TLS, verify it’s working:
# Test TLS handshake on main server (port 8086)
openssl s_client -connect your-domain.com:8086 -showcerts

# Verify certificate chain is valid
openssl s_client -connect your-domain.com:8086 -CAfile /etc/ssl/certs/ca-certificates.crt

# Test health check (no TLS, port 8080)
grpcurl -plaintext -d '{}' your-domain.com:8080 com.cisco.wcc.ccai.v1.Health/Check
Important:
- If
openssl s_clientshows certificate verification errors on port 8086, Webex Orchestrator will also reject the connection - Health checks on port 8080 do not require TLS and are always accessible
- Load balancers should use port 8080 for health checks to avoid certificate complexity
Important Security Notes
- Never commit certificates or private keys to version control
- Protect private key file permissions:
chmod 600 server.key - Use strong key sizes: Minimum 2048-bit RSA keys
- Monitor certificate expiration: Set up alerts for certificates expiring within 30 days
- Update data source URL to HTTPS: When registering your data source with Webex, use
https://instead ofhttp://
Step 5: Run the Simulator Locally
# Ensure Maven uses Java 17 (critical for Apple Silicon/ARM Macs)
export JAVA_HOME=$(/usr/libexec/java_home -v 17)

# Run the gRPC server
mvn exec:java -Dexec.mainClass="com.cisco.wccai.grpc.server.GrpcServer"
Expected Output:
With TLS Configured (Production-Ready):
INFO: Main server port: 8086, Health check port: 8080
INFO: ✓ Health check server started at port : 8080 (plaintext, no authentication required)
INFO: TLS enabled - Certificate: /path/to/server.crt, Key: /path/to/server.key
INFO: ✓ Secure gRPC server started at port : 8086 with TLS/SSL encryption
Without TLS (Development Only):
INFO: Main server port: 8086, Health check port: 8080
INFO: ✓ Health check server started at port : 8080 (plaintext, no authentication required)
WARN: ⚠️  WARNING: TLS is NOT configured! Main server will run WITHOUT encryption.
WARN: ⚠️  This is a SECURITY RISK and should ONLY be used for local development.
INFO: server started at port : 8086 (UNENCRYPTED)
Test the Server Locally:
Once the server is running, open a new terminal and verify it’s responding:
Note: If you don’t have grpcurl installed, download it from https://github.com/fullstorydev/grpcurl/releases or install via package manager:
# macOS
brew install grpcurl

# Linux
apt-get install grpcurl  # or yum install grpcurl
Testing Health Check (No Certificate Required):
# Health check on port 8080 (plaintext, always works)
grpcurl -plaintext -d '{}' :8080 com.cisco.wcc.ccai.v1.Health/Check

# List services on health check port
grpcurl -plaintext :8080 list
Testing Main Server with TLS:
# List available services on main server (requires CA-signed certificate)
grpcurl :8086 list

# Main server services require authentication
grpcurl :8086 com.cisco.wcc.ccai.media.v1.ConversationAudio/StreamConversationAudio
Local Testing (Development Only):
# For local development testing only - NOT for Webex integration
grpcurl -plaintext :8086 list
Note:
- Health checks always use port 8080 (plaintext, no certificate)
- Main audio services use port 8086 (TLS with CA-signed certificate required for production)
- Load balancers should use port 8080 for health checks
Expected Response:
{
  "status": "SERVING"
}
Note: The health check endpoint does not require authentication for local testing. It’s designed to be accessible for monitoring and verification purposes.
Stopping the Server:
When you’re done testing, stop the server by pressing Ctrl+C in the terminal where it’s running.
If you need to kill a server that’s running in the background:
# Find the process using port 8086
lsof -i :8086

# Kill the process (replace PID with the actual process ID from the output)
kill <PID>
IntelliJ IDEA Setup
For active development, IntelliJ IDEA provides a powerful environment for working with the Media Forking simulator.
Prerequisites
- IntelliJ IDEA: Download from JetBrains (Community or Ultimate edition)
- Java 17 JDK: Java 17 is recommended (Java 18-22 also supported but Java 17 provides best compatibility)
- Maven: IntelliJ has built-in Maven support
Import Project
- Open IntelliJ IDEA
- Select Open from the welcome screen (or File → Open)
- Navigate to and select the simulator directory specifically:
<REPO_ROOT>/webex-contact-center-provider-sample-code/media-service-api/dialog-connector-simulatorIMPORTANT: Make sure to select the
dialog-connector-simulatorsubdirectory, not the root repository directory - Select “Open as Project” when prompted
- Wait for Maven import to complete (visible in the status bar)
- IntelliJ will detect the
pom.xmlfile - Click “Import Maven Projects” in the notification that appears
- If Maven import doesn’t start automatically, right-click on
pom.xmland select Maven → Reload Project - Wait for Maven to download dependencies (this may take a few minutes)
- IntelliJ will detect the
Configure Java SDK
- Go to File → Project Structure → Project (or press
Cmd + ;on Mac) - Set SDK to Java 17
- Recommended: Microsoft OpenJDK 17 or Oracle JDK 17
- Compatible: Java 17-22 (17 recommended for best compatibility)
- Set Language level to 17 (project compiles to Java 17 bytecode)
- Click Apply and OK
Generate Protocol Buffer Classes
Before running the application, generate Java classes from .proto files:
- Open Maven Tool Window:
- Click View → Tool Windows → Maven (or press
Cmd + 1then select Maven)
- Click View → Tool Windows → Maven (or press
- Run Maven Goals:
- Expand dialog-connector-simulator → Lifecycle
- Double-click clean
- Double-click compile
- Verify Generated Classes:
- Check
target/generated-sources/protobuf/java/for generated files - IntelliJ should automatically mark this as a source folder (blue folder icon)
- Check
Create Local Run Configuration
- Click Run → Edit Configurations…
- Click the + button and select Application
- Configure as follows:
- Name:
Media Forking Simulator(orGrpcServer) - Main class:
com.cisco.wccai.grpc.server.GrpcServer - JRE: Select Java 17
- VM options:
-Xmx512m(optional, for memory allocation) - Working directory:
$MODULE_WORKING_DIR$(or leave as default) - Use classpath of module:
dialog-connector-simulator - Environment variables: (Optional) Add
GCS_BUCKET_NAME=localaudioto enable audio storage
- Name:
- Click Apply and OK
Running in IntelliJ
- Click the green Run button (▶️) in the toolbar (or press
Ctrl + Ron Mac /Shift + F10on Windows/Linux) - The server will start on port 8086
- Expected console output:
INFO: Starting gRPC Server... INFO: server started at port : 8086 INFO: Initializing the context INFO: Health service registered INFO: ConversationAudioFork service registered - Test Locally:
# In a terminal, test the health endpoint
grpcurl -plaintext localhost:8086 com.cisco.wcc.ccai.v1.Health/Check
Debug Mode
To debug the simulator:
- Set Breakpoints:
- Open
ConversationAudioForkServiceImpl.java - Click in the left gutter next to line numbers to set breakpoints
- Recommended breakpoints:
onNext()method (when audio chunks arrive)onCompleted()method (when stream ends)
- Open
- Start Debug Session:
- Click the Debug button (🐛) instead of Run
- Or press
Ctrl + D(Mac) /Shift + F9(Windows/Linux)
- Inspect Variables:
- When breakpoint hits, inspect audio data, conversation IDs, etc.
- Use Evaluate Expression (
Alt + F8) to test code snippets
Troubleshooting IntelliJ Setup
Maven Import Issues
If Maven import fails or dependencies aren’t recognized:
- Check Java version: Ensure Maven uses Java 17
export JAVA_HOME=$(/usr/libexec/java_home -v 17)
mvn -version
Maven should report using Java 17, not a newer version like Java 25
- Clear caches: File → Invalidate Caches / Restart
Project Structure Issues
If you see many red underlines in the code:
- Verify you opened the correct subdirectory:
dialog-connector-simulator - Check Project Structure (File → Project Structure) has Java 17 selected
- Rebuild project: Build → Rebuild Project
Step 6: Deploy to a Public Endpoint
For WXCC to connect to your simulator, it must be publicly accessible. Before deploying to the cloud, it’s recommended to test your Docker container locally.
Step 6a: Test Docker Container Locally (Recommended)
Before deploying to Google Cloud or other platforms, verify your Docker image works correctly on your local machine.
1. Build the Docker Image Locally:
The project includes a multi-stage Dockerfile that compiles inside the container. However, for faster local development, you can also build the JAR first in IntelliJ.
Option A: Quick Development Build (Recommended for Local Testing)
If you’re actively developing in IntelliJ, build the JAR locally first for faster Docker builds:
# Navigate to the project directory
cd <REPO_ROOT>/webex-contact-center-provider-sample-code/media-service-api/dialog-connector-simulator

# Ensure Maven uses Java 17 (critical for Apple Silicon/ARM Macs)
export JAVA_HOME=$(/usr/libexec/java_home -v 17)

# Build the JAR in IntelliJ or via Maven
mvn clean install

# Create a simple Dockerfile.dev (if not exists)
cat > Dockerfile.dev << 'EOF'
FROM eclipse-temurin:17-jre
WORKDIR /app
COPY target/*-allinone.jar /app/app.jar
EXPOSE 8086
ENTRYPOINT ["java", "-jar", "/app/app.jar"]
EOF

# Build Docker image using the dev Dockerfile
docker build -f Dockerfile.dev -t media-forking-simulator:local .
Pros: Fast rebuilds (~5 seconds), easier debugging, leverages your IntelliJ build
Option B: Multi-Stage Build (Production-Ready)
Use the standard Dockerfile that compiles everything inside the container:
# Navigate to the project directory
cd <REPO_ROOT>/webex-contact-center-provider-sample-code/media-service-api/dialog-connector-simulator

# Build Docker image (compiles inside container)
docker build -t media-forking-simulator:local .
What happens during multi-stage build:
- Build Stage: Uses
eclipse-temurin:17-jdkimage- Installs Maven
- Downloads dependencies
- Compiles the project (
mvn clean package) - Creates the all-in-one JAR
- Runtime Stage: Uses smaller
eclipse-temurin:17-jreimage- Copies only the compiled JAR from build stage
- Sets up non-root user for security
- Configures Java optimizations
Pros: Reproducible builds, no local dependencies, CI/CD ready
Which to use?
- Local development/testing: Use Option A (faster iteration)
- Production/CI/CD: Use Option B (reproducible builds)
2. Run the Container Locally:
# Run the container
docker run -p 8086:8086 media-forking-simulator:local

# Or run in detached mode
docker run -d -p 8086:8086 --name media-forking-test media-forking-simulator:local
3. Test the Local Container:
# Test health endpoint
grpcurl -plaintext localhost:8086 com.cisco.wcc.ccai.v1.Health/Check

# List available services
grpcurl -plaintext localhost:8086 list
Expected Response:
{
  "status": "SERVING"
}
4. View Container Logs:
# View logs (if running in detached mode)
docker logs media-forking-test

# Follow logs in real-time
docker logs -f media-forking-test
5. Stop and Remove Container:
# Stop the container
docker stop media-forking-test

# Remove the container
docker rm media-forking-test
IntelliJ Docker Configuration:
If you have a Docker run configuration in IntelliJ:
- Open Run/Debug Configurations (Run → Edit Configurations)
- Select your Docker configuration
- Run the configuration (▶️ button)
- View logs in the IntelliJ Run tool window
- Stop the container using the stop button (⏹️)
Troubleshooting Local Docker:
- Port already in use: Make sure no other process is using port 8086
lsof -i :8086 kill <PID> - Image build fails: Ensure
mvn clean installcompleted successfully - Container exits immediately: Check logs with
docker logs <container-id>
Step 6b: Deploy to Cloud Platforms
Once you’ve verified the Docker container works locally, deploy it to a public endpoint.
Note: This guide covers command-line deployment using
gcloudCLI. IntelliJ IDEA Cloud Code plugin deployment will be covered in a future update once configuration issues are resolved.
Option A: Deploy to Google Cloud Run (Recommended for Testing)
Google Cloud Run is ideal for testing because it’s serverless, scales automatically, and has a generous free tier.
Prerequisites:
- Google Cloud account with billing enabled
gcloudCLI installed and authenticated- Project ID ready (replace
YOUR_PROJECT_IDbelow)- Important: Project ID must be lowercase (e.g.,
cloudrungrpcnotCloudRunGRPC)
- Important: Project ID must be lowercase (e.g.,
For Apple Silicon Macs (M1/M2/M3):
The base image needs to support multiple platforms. Use Docker buildx for multi-platform builds:
# Navigate to project directory
cd <REPO_ROOT>/webex-contact-center-provider-sample-code/media-service-api/dialog-connector-simulator

# Enable buildx (if not already enabled)
docker buildx create --use

# Build for AMD64 (Cloud Run) and push directly
# Note: This will compile the project inside Docker (takes 2-3 minutes)
docker buildx build --platform linux/amd64 \
  -t gcr.io/YOUR_PROJECT_ID/media-forking-simulator:v1 \
  --push .
For Intel Macs or Linux:
# Navigate to project directory
cd <REPO_ROOT>/webex-contact-center-provider-sample-code/media-service-api/dialog-connector-simulator

# Build Docker image (compiles inside container)
docker build -t gcr.io/YOUR_PROJECT_ID/media-forking-simulator:v1 .

# Push to Google Container Registry
docker push gcr.io/YOUR_PROJECT_ID/media-forking-simulator:v1
Deploy to Cloud Run:
gcloud run deploy media-forking-simulator \
  --image gcr.io/YOUR_PROJECT_ID/media-forking-simulator:v1 \
  --platform managed \
  --region us-central1 \
  --allow-unauthenticated \
  --port 8086 \
  --memory 512Mi \
  --cpu 1 \
  --max-instances 10 \
  --set-env-vars DATASOURCE_URL=https://media-forking-simulator-abc123-uc.a.run.app
Important: Replace https://media-forking-simulator-abc123-uc.a.run.app with your actual Cloud Run service URL after the first deployment. You can update the environment variable later using:
gcloud run services update media-forking-simulator \
  --region us-central1 \
  --set-env-vars DATASOURCE_URL=https://your-actual-service-url.run.app
Expected Output:
Deploying container to Cloud Run service [media-forking-simulator] in project [YOUR_PROJECT_ID] region [us-central1]
✓ Deploying... Done.
  ✓ Creating Revision...
  ✓ Routing traffic...
Done.
Service [media-forking-simulator] revision [media-forking-simulator-00001-abc] has been deployed and is serving 100 percent of traffic.
Service URL: https://media-forking-simulator-abc123-uc.a.run.app
Save the Service URL - you’ll need it for:
- WXCC data source registration (Step 5 in Webex Configuration)
- Setting the DATASOURCE_URL environment variable (must match exactly)
View Logs:
# View recent logs
gcloud run services logs read media-forking-simulator --region us-central1 --limit 50

# Stream logs in real-time
gcloud run services logs tail media-forking-simulator --region us-central1
Update Deployment:
# After making code changes, rebuild and redeploy
docker build -t gcr.io/YOUR_PROJECT_ID/media-forking-simulator:v2 .
docker push gcr.io/YOUR_PROJECT_ID/media-forking-simulator:v2

gcloud run deploy media-forking-simulator \
  --image gcr.io/YOUR_PROJECT_ID/media-forking-simulator:v2 \
  --region us-central1
Cost Estimate:
- Free tier: 2 million requests/month, 360,000 GB-seconds/month
- Typical usage: ~$5-20/month for development/testing
- Production: Scales with usage
Option B: Use ngrok for Local Testing
# Install ngrok (if not already installed)
# Download from https://ngrok.com/download

# Start ngrok tunnel
ngrok tcp 8086
Note: ngrok will provide a public endpoint like tcp://0.tcp.ngrok.io:12345
Option C: Deploy to Your Own Infrastructure
- Deploy to AWS ECS, Azure Container Instances, or your own Kubernetes cluster
- Ensure the endpoint is publicly accessible
- Configure appropriate security groups and firewall rules
Step 6: Verify the Simulator is Running
Test the health endpoint to confirm your deployment is working.
For Cloud Run Deployments:
Cloud Run automatically provides TLS, so you don’t use -plaintext and must specify port 443:
# Test Cloud Run endpoint (must specify port 443)
grpcurl YOUR_SERVICE_NAME.run.app:443 com.cisco.wcc.ccai.v1.Health/Check

# Example:
grpcurl media-forking-simulator-908846715353.us-central1.run.app:443 com.cisco.wcc.ccai.v1.Health/Check
For Local Testing:
Local containers use plaintext (no TLS) on port 8086:
# Test local endpoint (plaintext on port 8086)
grpcurl -plaintext localhost:8086 com.cisco.wcc.ccai.v1.Health/Check
Common Mistakes:
- ❌
grpcurl -plaintext https://your-service.run.app:8086- Don’t usehttps://,-plaintext, or:8086with Cloud Run - ❌
grpcurl your-service.run.app:8086- Cloud Run uses port 443, not 8086 - ✅
grpcurl your-service.run.app:443- Correct for Cloud Run - ✅
grpcurl -plaintext localhost:8086- Correct for local testing
Expected Response:
{
  "status": "SERVING"
}
Note: The Health service returns a simple status enum (UNKNOWN, SERVING, or NOT_SERVING) as defined in the gRPC health check protocol.
Audio Storage Feature
The simulator automatically saves received audio streams as WAV files. This feature helps you verify that audio is being received correctly and provides recordings for analysis.
How It Works
Automatic Environment Detection:
- Cloud Run: Saves WAV files to Google Cloud Storage bucket
ccaiaudiofiles - Local: Saves WAV files to
target/audio/directory
File Naming:
- Format:
audio/{conversationId}-{roleId}.wav - Example:
audio/050bdbad-dfcc-4049-b39d-81e2643b00f7-7bbcc1ed-170f-4dfa-a37c-d51179cfd50f.wav - Separate files for each role (customer and agent)
- Files stored in
audio/subdirectory within the bucket
Audio Format:
- Format: WAV with proper headers
- Encoding: Automatically detected from stream
- LINEAR16 → PCM format (format code 1, 16-bit)
- MULAW → G.711 μ-law format (format code 7, 8-bit)
- Sample Rate: As received from WXCC (typically 8kHz)
- Channels: Mono (1 channel per role)
Configuration
Audio storage is controlled by the GCS_BUCKET_NAME environment variable:
For Cloud Run:
# Set during deployment
gcloud run deploy media-forking-simulator \
  --image gcr.io/cloudrungrpc/media-forking-simulator:v2 \
  --region us-central1 \
  --set-env-vars GCS_BUCKET_NAME=ccaiaudiofiles
For local testing:
# Set environment variable before running
export GCS_BUCKET_NAME=ccaiaudiofiles
java -jar target/dialog-connector-simulator-1.0.0-SNAPSHOT-allinone.jar
To disable audio storage: Don’t set the GCS_BUCKET_NAME environment variable. The service will return an error if audio forking is attempted without GCS configured.
Viewing Saved Audio Files
On Cloud Run:
- Navigate to Google Cloud Storage:
# List files in the bucket gsutil ls gs://ccaiaudiofiles/audio/ # Download a specific file gsutil cp gs://ccaiaudiofiles/audio/CONVERSATION_ID-ROLE_ID.wav ./ - Or use the Cloud Console:
- Go to: https://console.cloud.google.com/storage/browser/ccaiaudiofiles/audio
- Browse and download files
Locally:
# Audio files are saved to target/audio/ (if GCS_BUCKET_NAME is set and GCS is accessible)
ls -la target/audio/

# Play audio (macOS)
afplay CONVERSATION_ID-ROLE_ID.wav

# Play audio (Linux)
aplay CONVERSATION_ID-ROLE_ID.wav
Audio Processing Workflow
- Audio chunks received from WXCC via gRPC stream
- Buffered by participant (customer and agent tracked separately)
- When stream completes (isFinal flag received):
- Complete audio assembled from chunks
- WAV header added
- File saved to GCS (Cloud Run) or local directory
Troubleshooting Audio Storage
Issue: No audio files appearing
Check logs:
# Cloud Run
gcloud run services logs read media-forking-simulator --region us-central1 | grep -i "audio"

# Look for:
# - "Token validation successful" (good)
# - "Token validation failed" (bad)
# - "JWT token is expired" (token expired)
# - "Claims validation failed" (URL or schema mismatch)
Verify configuration:
- Ensure
GCS_BUCKET_NAMEenvironment variable is set - Cloud Run: Check deployment env vars:
gcloud run services describe media-forking-simulator --region us-central1 --format="value(spec.template.spec.containers[0].env)" - Local: Check env var:
echo $GCS_BUCKET_NAME
Cloud Run specific:
- Verify the service account has write permissions to the GCS bucket
- Check bucket exists:
gsutil ls gs://ccaiaudiofiles/ - Create bucket if needed:
gsutil mb gs://ccaiaudiofiles/ - Verify bucket has
audio/directory (created automatically on first upload)
Local specific:
- Requires Google Cloud credentials configured locally
- Run
gcloud auth application-default loginto set up credentials - Service will attempt to use default GCS credentials
Issue: Audio files are empty or corrupted
Possible causes:
- Audio stream ended prematurely
- Incorrect audio encoding format
- Sample rate mismatch
Check logs for:
- Audio chunk sizes
- Sample rate values
- Encoding type (should be LINEAR16 or MULAW)
Security Considerations
Google Cloud Storage:
- Audio files may contain sensitive customer conversations
- Ensure bucket has appropriate access controls
- Consider enabling encryption at rest
- Set lifecycle policies to auto-delete old files
# Set bucket to private (recommended)
gsutil iam ch allUsers:objectViewer gs://ccaiaudiofiles/
gsutil iam ch -d allUsers gs://ccaiaudiofiles/

# Add lifecycle rule to delete files after 30 days
cat > lifecycle.json << EOF
{
  "lifecycle": {
    "rule": [
      {
        "action": {"type": "Delete"},
        "condition": {"age": 30}
      }
    ]
  }
}
EOF
gsutil lifecycle set lifecycle.json gs://ccaiaudiofiles/
Compliance:
- Check your organization’s data retention policies
- Ensure compliance with regulations (GDPR, CCPA, etc.)
- Consider PCI-DSS requirements if handling payment card data
- Implement appropriate access logging and monitoring
JWS Token Authentication
The simulator implements robust security by validating JWS (JSON Web Signature) tokens sent by WXCC. This ensures that only authenticated requests from Cisco’s Webex Contact Center can access your media forking endpoint.
How It Works
Authentication Flow:
- WXCC sends gRPC request with JWS token in
authorizationheader - AuthorizationServerInterceptor intercepts the request
- Token extracted and routed to appropriate handler
- JWTAuthorizationHandler validates:
- Token signature using Cisco’s public key
- Token expiration
- Issuer (must be Cisco Identity Broker)
- Claims (audience, subject, JWT ID)
- Datasource URL (must match your configured endpoint)
- Schema UUID (must be media forking schema)
- Request allowed if validation succeeds, rejected otherwise
Configuration
Set your datasource URL in config.properties:
# Datasource URL for JWT validation - must match the URL in JWT claims
# This URL represents where your dialog connector simulator is accessible
# For local development with ngrok, use your ngrok URL
# For production, use your actual service URL
DATASOURCE_URL = https://media-forking-simulator-908846715353.us-central1.run.app:443
Important: This URL must exactly match the datasource URL you register with WXCC.
Security Features
1. Signature Verification
- Fetches Cisco’s public keys from Identity Broker
- Validates token signature using RSA public key cryptography
- Ensures token hasn’t been tampered with
2. Token Expiration
- Checks token expiration timestamp
- Rejects expired tokens automatically
3. Claims Validation
- Issuer: Must be one of Cisco’s valid Identity Broker URLs
https://idbroker.webex.com/idbhttps://idbroker-eu.webex.com/idbhttps://idbroker-b-us.webex.com/idbhttps://idbroker-ca.webex.com/idbhttps://idbrokerbts.webex.com/idb(test)https://idbrokerbts-eu.webex.com/idb(test)
- Audience: Must be present
- Subject: Must be present
- JWT ID: Must be present
4. Datasource URL Validation
- Token must contain
com.cisco.datasource.urlclaim - Value must match your configured
DATASOURCE_URL - Prevents tokens intended for other endpoints from being accepted
5. Schema UUID Validation
- Token must contain
com.cisco.datasource.schema.uuidclaim - Value must be
5397013b-7920-4ffc-807c-e8a3e0a18f43(media forking schema) - Ensures token is specifically for media forking, not other services
6. Public Key Caching
- Public keys cached for 60 minutes
- Reduces latency and API calls
- Handles rate limiting gracefully
Authentication Bypass
The following services do not require authentication:
- Health Check:
com.cisco.wcc.ccai.v1.Health/Check - gRPC Reflection: For service discovery with
grpcurl
This allows you to test the health endpoint without tokens.
Testing Authentication
Test without token (should fail):
# This will fail with UNAUTHENTICATED error
grpcurl media-forking-simulator-908846715353.us-central1.run.app:443 \
  com.cisco.wcc.ccai.media.v1.ConversationAudio/StreamConversationAudio
Expected error:
ERROR:
  Code: Unauthenticated
  Message: Authorization failed: Invalid authorization token
Test with valid token (from WXCC):
# WXCC automatically includes the JWS token when connecting
# You don't need to manually provide it
Troubleshooting Authentication
Issue: All requests failing with “Authorization failed”
Check logs:
# Cloud Run
gcloud run services logs read media-forking-simulator --region us-central1 | grep -i "authorization\|token"

# Look for:
# - "Token validation successful" (good)
# - "Token validation failed" (bad)
# - "JWT token is expired" (token expired)
# - "Claims validation failed" (URL or schema mismatch)
Common causes:
- Datasource URL mismatch
- Token contains different URL than your
DATASOURCE_URL - Solution: Update
DATASOURCE_URLinconfig.propertiesto match your registered datasource - Rebuild and redeploy:
mvn clean install
- Token contains different URL than your
- Token expired
- JWS tokens have expiration timestamps
- Solution: You must update your data source registration with a new nonce and expiration before the current token expires
- WXCC uses the nonce and expiration from your data source registration to construct JWS tokens
- Best practice: Refresh every 12 hours (minimum 1 hour, maximum 24 hours)
- Invalid issuer
- Token from unexpected source
- Solution: Verify token is from Cisco Identity Broker
- Public key fetch failed
- Can’t reach Identity Broker
- Solution: Check network connectivity, firewall rules
Issue: Health check failing
Health checks should not require authentication. If failing:
# Verify health check bypass is working
grpcurl media-forking-simulator-908846715353.us-central1.run.app:443 \
  com.cisco.wcc.ccai.v1.Health/Check
Should return {"status": "SERVING"} without any token.
Security Best Practices
1. Keep DATASOURCE_URL Secure
- Don’t commit sensitive URLs to public repositories
- Use environment variables for production deployments
- Rotate URLs if compromised
2. Monitor Authentication Failures
- Set up alerts for repeated authentication failures
- May indicate attack attempts or misconfiguration
3. Log Security Events
- Authentication successes and failures are logged
- Review logs regularly for suspicious activity
4. Update Dependencies
- Keep
nimbus-jose-jwtlibrary updated - Security patches for cryptographic libraries are critical
5. Network Security
- Use TLS for all connections (automatic on Cloud Run)
- Don’t expose gRPC endpoint without authentication
- Consider additional network-level security (VPC, firewall rules)
Recent Improvements to JWS Token Verification
The sample code has been enhanced to handle real-world scenarios encountered by customers:
1. Forward-Compatible Field Handling
Common Identity may add new fields to the public key response (such as the alg field). The code now:
- Parses the
algfield when present - Ignores unknown fields using
@JsonIgnoreProperties(ignoreUnknown = true) - Best Practice: Always design your integration to ignore unknown fields - this is considered a non-breaking change in API design
2. Rate Limit Handling with Retry-After Header and Exponential Backoff
The public key endpoint may return HTTP 429 (Too Many Requests) during high load. The code now implements:
- Retry-After Header: Honors the
Retry-Afterheader when present (priority) - Exponential Backoff Fallback: Uses exponential backoff (1s → 2s → 4s) if no
Retry-Afterheader - Max Attempts: Up to 3 retry attempts
- Fallback: Returns cached public keys if retries are exhausted
- Logging: Detailed logs for retry attempts, headers, and rate limit events
Example retry sequence with Retry-After header:
Attempt 1: Request → 429 received → Retry-After: 5 → Wait 5 seconds
Attempt 2: Request → 429 received → Retry-After: 10 → Wait 10 seconds
Attempt 3: Request → 429 received → Return cached keys or fail
Example retry sequence without Retry-After header (exponential backoff):
Attempt 1: Request → 429 received → Wait 1 second
Attempt 2: Request → 429 received → Wait 2 seconds
Attempt 3: Request → 429 received → Wait 4 seconds → Return cached keys or fail
3. Cache-Control Header Support
The public key endpoint now returns a Cache-Control header with max-age directive. The code:
- Parses the
Cache-Controlheader to extract cache duration - Uses the server-specified cache duration instead of hardcoded 60 minutes
- Falls back to default duration if header is missing or invalid
- Example:
Cache-Control: public, max-age=21600→ Cache for 6 hours
Configuration:
// Retry configuration
private static final int MAX_RETRY_ATTEMPTS = 3;
private static final long INITIAL_RETRY_DELAY_MS = 1000; // 1 second

// Default cache duration (used if Cache-Control header is missing)
private static final long CACHE_DURATION = TimeUnit.MINUTES.toMillis(60);
Why These Changes Matter:
- Resilience: Your integration won’t break when Common Identity adds new fields
- Reliability: Handles rate limiting gracefully without failing requests
- Efficiency: Respects server-specified cache durations for optimal performance (6 hours vs 60 minutes)
- Production-Ready: Based on real customer issues and best practices
Implementation Details
Key Classes:
AuthorizationServerInterceptor- Intercepts all gRPC callsJWTAuthorizationHandler- Validates JWS tokens with retry logic and cache managementAuthorizationHandlerFactory- Routes to appropriate handlerPublicKeyResponse- Caches Cisco’s public keys with forward-compatible field handling
Dependencies:
nimbus-jose-jwt- JWT parsing and validationjackson-databind- JSON parsing with unknown field handling
Google Cloud Integration Best Practices
1. Use Google Cloud Storage for Audio
Store received audio in Google Cloud Storage:
// Add to pom.xml (already included)
<dependency>
    <groupId>com.google.cloud</groupId>
    <artifactId>google-cloud-storage</artifactId>
    <version>2.38.0</version>
</dependency>

// In your audio handler
import com.google.cloud.storage.Storage;
import com.google.cloud.storage.StorageOptions;
import com.google.cloud.storage.BlobInfo;

Storage storage = StorageOptions.getDefaultInstance().getService();
BlobInfo blobInfo = BlobInfo.newBuilder("your-bucket", "audio-file.wav").build();
storage.create(blobInfo, audioBytes);
2. Use Cloud Logging
The project uses Logback with Logstash encoder for structured logging:
import org.slf4j.Logger;
import org.slf4j.LoggerFactory;

private static final Logger logger = LoggerFactory.getLogger(YourClass.class);

// Logs automatically appear in Cloud Logging
logger.info("Received audio chunk: {} bytes", audioData.length);
logger.error("Error processing audio", exception);
3. Use Secret Manager for Credentials
Store sensitive data in Google Secret Manager:
# Create secret
echo -n "your-jwt-secret" | gcloud secrets create jwt-secret --data-file=-

# Grant Cloud Run access
gcloud secrets add-iam-policy-binding jwt-secret \
  --member="serviceAccount:YOUR_SERVICE_ACCOUNT" \
  --role="roles/secretmanager.secretAccessor"

# Reference in Cloud Run
gcloud run services update media-forking-simulator \
  --set-secrets="JWT_SECRET=jwt-secret:latest"
4. Enable Cloud Monitoring
Monitor your service performance:
- Navigate to: Cloud Monitoring
- Create Dashboard for your service
- Add Metrics:
- Request count
- Request latency
- Error rate
- Memory usage
- CPU utilization
5. Set Up Alerts
# Create alert for high error rate
gcloud alpha monitoring policies create \
  --notification-channels=CHANNEL_ID \
  --display-name="High Error Rate" \
  --condition-display-name="Error rate > 5%" \
  --condition-threshold-value=0.05 \
  --condition-threshold-duration=300s
Step-by-Step Setup Guide
Overview: What We’ve Built and What Comes Next
In the previous sections, you’ve successfully set up and deployed the Media Forking simulator. Here’s what you’ve accomplished:
✅ Simulator Setup Complete:
- Built and tested the gRPC server locally
- Deployed the simulator to a publicly accessible endpoint (Google Cloud Run, ngrok, or your own infrastructure)
- Verified the health endpoint is responding
- Confirmed authentication is working (rejecting requests without valid tokens)
How the Simulator Works:
The simulator acts as a media sink that receives real-time audio streams from Webex Contact Center during active calls. Here’s the flow:
- WXCC Initiates Connection: When a call enters a flow with media forking enabled, WXCC’s Orchestrator establishes a bidirectional gRPC stream to your simulator endpoint
- Authentication: WXCC includes a JWS (JSON Web Signature) token that your simulator validates against Webex’s public keys
- Audio Streaming: WXCC sends audio chunks in real-time as the conversation progresses
- Storage: The simulator saves the audio to WAV files (locally or in Google Cloud Storage)
- Response: Your simulator can send responses back (though the current implementation focuses on receiving and storing audio)
What’s Next: WXCC Configuration
Now that your simulator is ready to receive media streams, you need to configure Webex Contact Center to send audio to your endpoint. This involves several steps:
- Create a Service App - Register your application with Webex
- Authorize the Service App - Customer admin grants your app permission to access their organization
- Obtain OAuth Tokens - Get credentials to manage data source registrations
- Register Your Data Source - Tell WXCC where to send media streams for each customer organization
- Manage JWS Tokens - Keep authentication credentials fresh (update every 12 hours)
- Create a Flow - Configure WXCC to fork media for specific calls
Let’s walk through each step in detail.
Step 1: Request a Contact Center Sandbox (Partners/Developers)
Tool: Webex Developer Sandbox Request
Before you can test media forking, you need access to a Webex Contact Center organization. You have two options:
Option A: Use a Contact Center Sandbox (Recommended for Development)
- Request a sandbox: Visit https://developer.webex.com/create/docs/sandbox_cc
- Provisioning time: Sandboxes are typically provisioned within 15 minutes
- What you get:
- A fully functional Webex Contact Center environment
- Two pre-provisioned agent accounts
- Access to Control Hub for configuration
- Entry points and phone numbers for testing
Option B: Use Your Own Organization
You can also develop and test in your own Webex Contact Center organization if you have one.
Important: Feature Toggle Enablement Required
⚠️ Before media forking will work, feature toggles must be enabled for your organization.
Action Required:
- Get your Organization ID:
- Login to Control Hub (https://admin.webex.com)
- Your Organization ID is visible in the URL or in Account settings
- Format:
05ba0660-6b05-48b0-9185-7343434c0784
- Contact your Product Manager with:
- Your Organization ID (sandbox or development org)
- Request to enable media forking feature toggles
- Mention you’re developing a media forking integration
- Wait for confirmation that toggles are enabled before proceeding
Why is this needed?
During the pre-GA (General Availability) phase, media forking requires manual feature toggle enablement for development and testing purposes. Without these toggles, you won’t see the media forking schema option when creating your Service App.
Note: Once media forking reaches GA and customers purchase a media forking subscription, feature toggles will be automatically enabled based on the subscription. This manual enablement step is only required during the development/pre-GA phase.
Step 2: Create a Service App
Tool: Webex Developer Portal
Who performs this step:
- For sandbox testing: Any of the pre-provisioned accounts in the sandbox (agent accounts or admin)
- For production: The partner creates the Service App in their own partner Webex account
What is a Service App?
A Service App is a special type of Webex application that operates independently of user authentication. Unlike integrations that act on behalf of users, Service Apps use machine accounts and are authorized at the organization level. Learn more: Service Apps Documentation
Steps:
- Login to the Webex Developer Portal:
- Sandbox: Use any of the pre-provisioned sandbox accounts
- Production: Use your partner Webex account
- Navigate to My Webex Apps
-
Click Create a New App → Create a Service App
- Fill in the registration form:
- Name: Your media forking service name (e.g., “Acme Real-Time Analytics”)
- Description: Clear explanation of your media forking service and value proposition
- Logo: Professional logo (displayed to customer admins)
- Icon: App icon
- Support URL: Your support contact page
- Privacy URL: Your privacy policy
- Select Data Source Schema:
- ✅ Media Forking Schema (this wraps the protobuf protocol)
- In the Developer Portal, this schema is labeled as
audio_forking_schema - ❌ NOT the “Bring Your Own Virtual Agent” schema
- Important: If you don’t see the “Media Forking Schema” or
audio_forking_schemaoption, the feature toggles have not been enabled for your organization. Contact your Product Manager.
- Specify Data Exchange Domain:
- This is the base domain where your gRPC endpoint is hosted
- For Google Cloud Run: Use the base domain without
https://- Example:
media-forking-simulator-908846715353.us-central1.run.app - For URL:
https://media-forking-simulator-908846715353.us-central1.run.app
- Example:
- Best Practice: Use a custom domain (e.g.,
media.yourcompany.com) instead of Cloud Run URLs, as Cloud Run URLs may change - Important: This domain is validated. Your actual data source URLs must be this domain or subdomains/paths under it.
- Select Required Scopes:
- ✅
spark-admin:dataSource_read(Required - read data source configurations) - ✅
spark-admin:dataSource_write(Required - register data sources) - ❌ No other scopes are needed for media forking
- ✅
- Save and Copy Credentials:
- Client ID: Copy and save securely
- Client Secret: ⚠️ Shown only once! Copy and save securely
- Service App ID: Copy this for reference - the authorized Service App will be selectable by name in the Flow Designer
- You’ll need the Client ID and Secret to retrieve organization-specific tokens
- Submit for Admin Approval:
- Click “Request Admin Authorization” (for testing in your sandbox/own org)
- Or “Submit to App Hub” (for production deployment to customer orgs)
- This makes your Service App visible in Control Hub for authorization
Step 3: Admin Authorization (Customer Org Admin)
Tool: Webex Control Hub
⚠️ This step is performed by the customer’s Full Admin.
Provide these instructions to your customers:
- Login to Control Hub: https://admin.webex.com
- Navigate to: Apps → Service Apps
- Find your Service App in the list (or via App Hub if published)
- Review the app details carefully:
- Partner/Developer information: Who created this app
- Description: What the app does
- Data destination URL: Where media will be sent
- Schema: What type of data is being sent (Media Forking)
- Requested scopes: What permissions the app needs
- Click “Authorize”
- Confirm authorization
What happens behind the scenes:
- Your Service App is authorized for the customer’s organization
- A machine account is created for your Service App
- The Service App becomes selectable in Flow Designer for media forking activities
- You (the partner) can now retrieve organization-specific access and refresh tokens
- You can register data sources for this organization
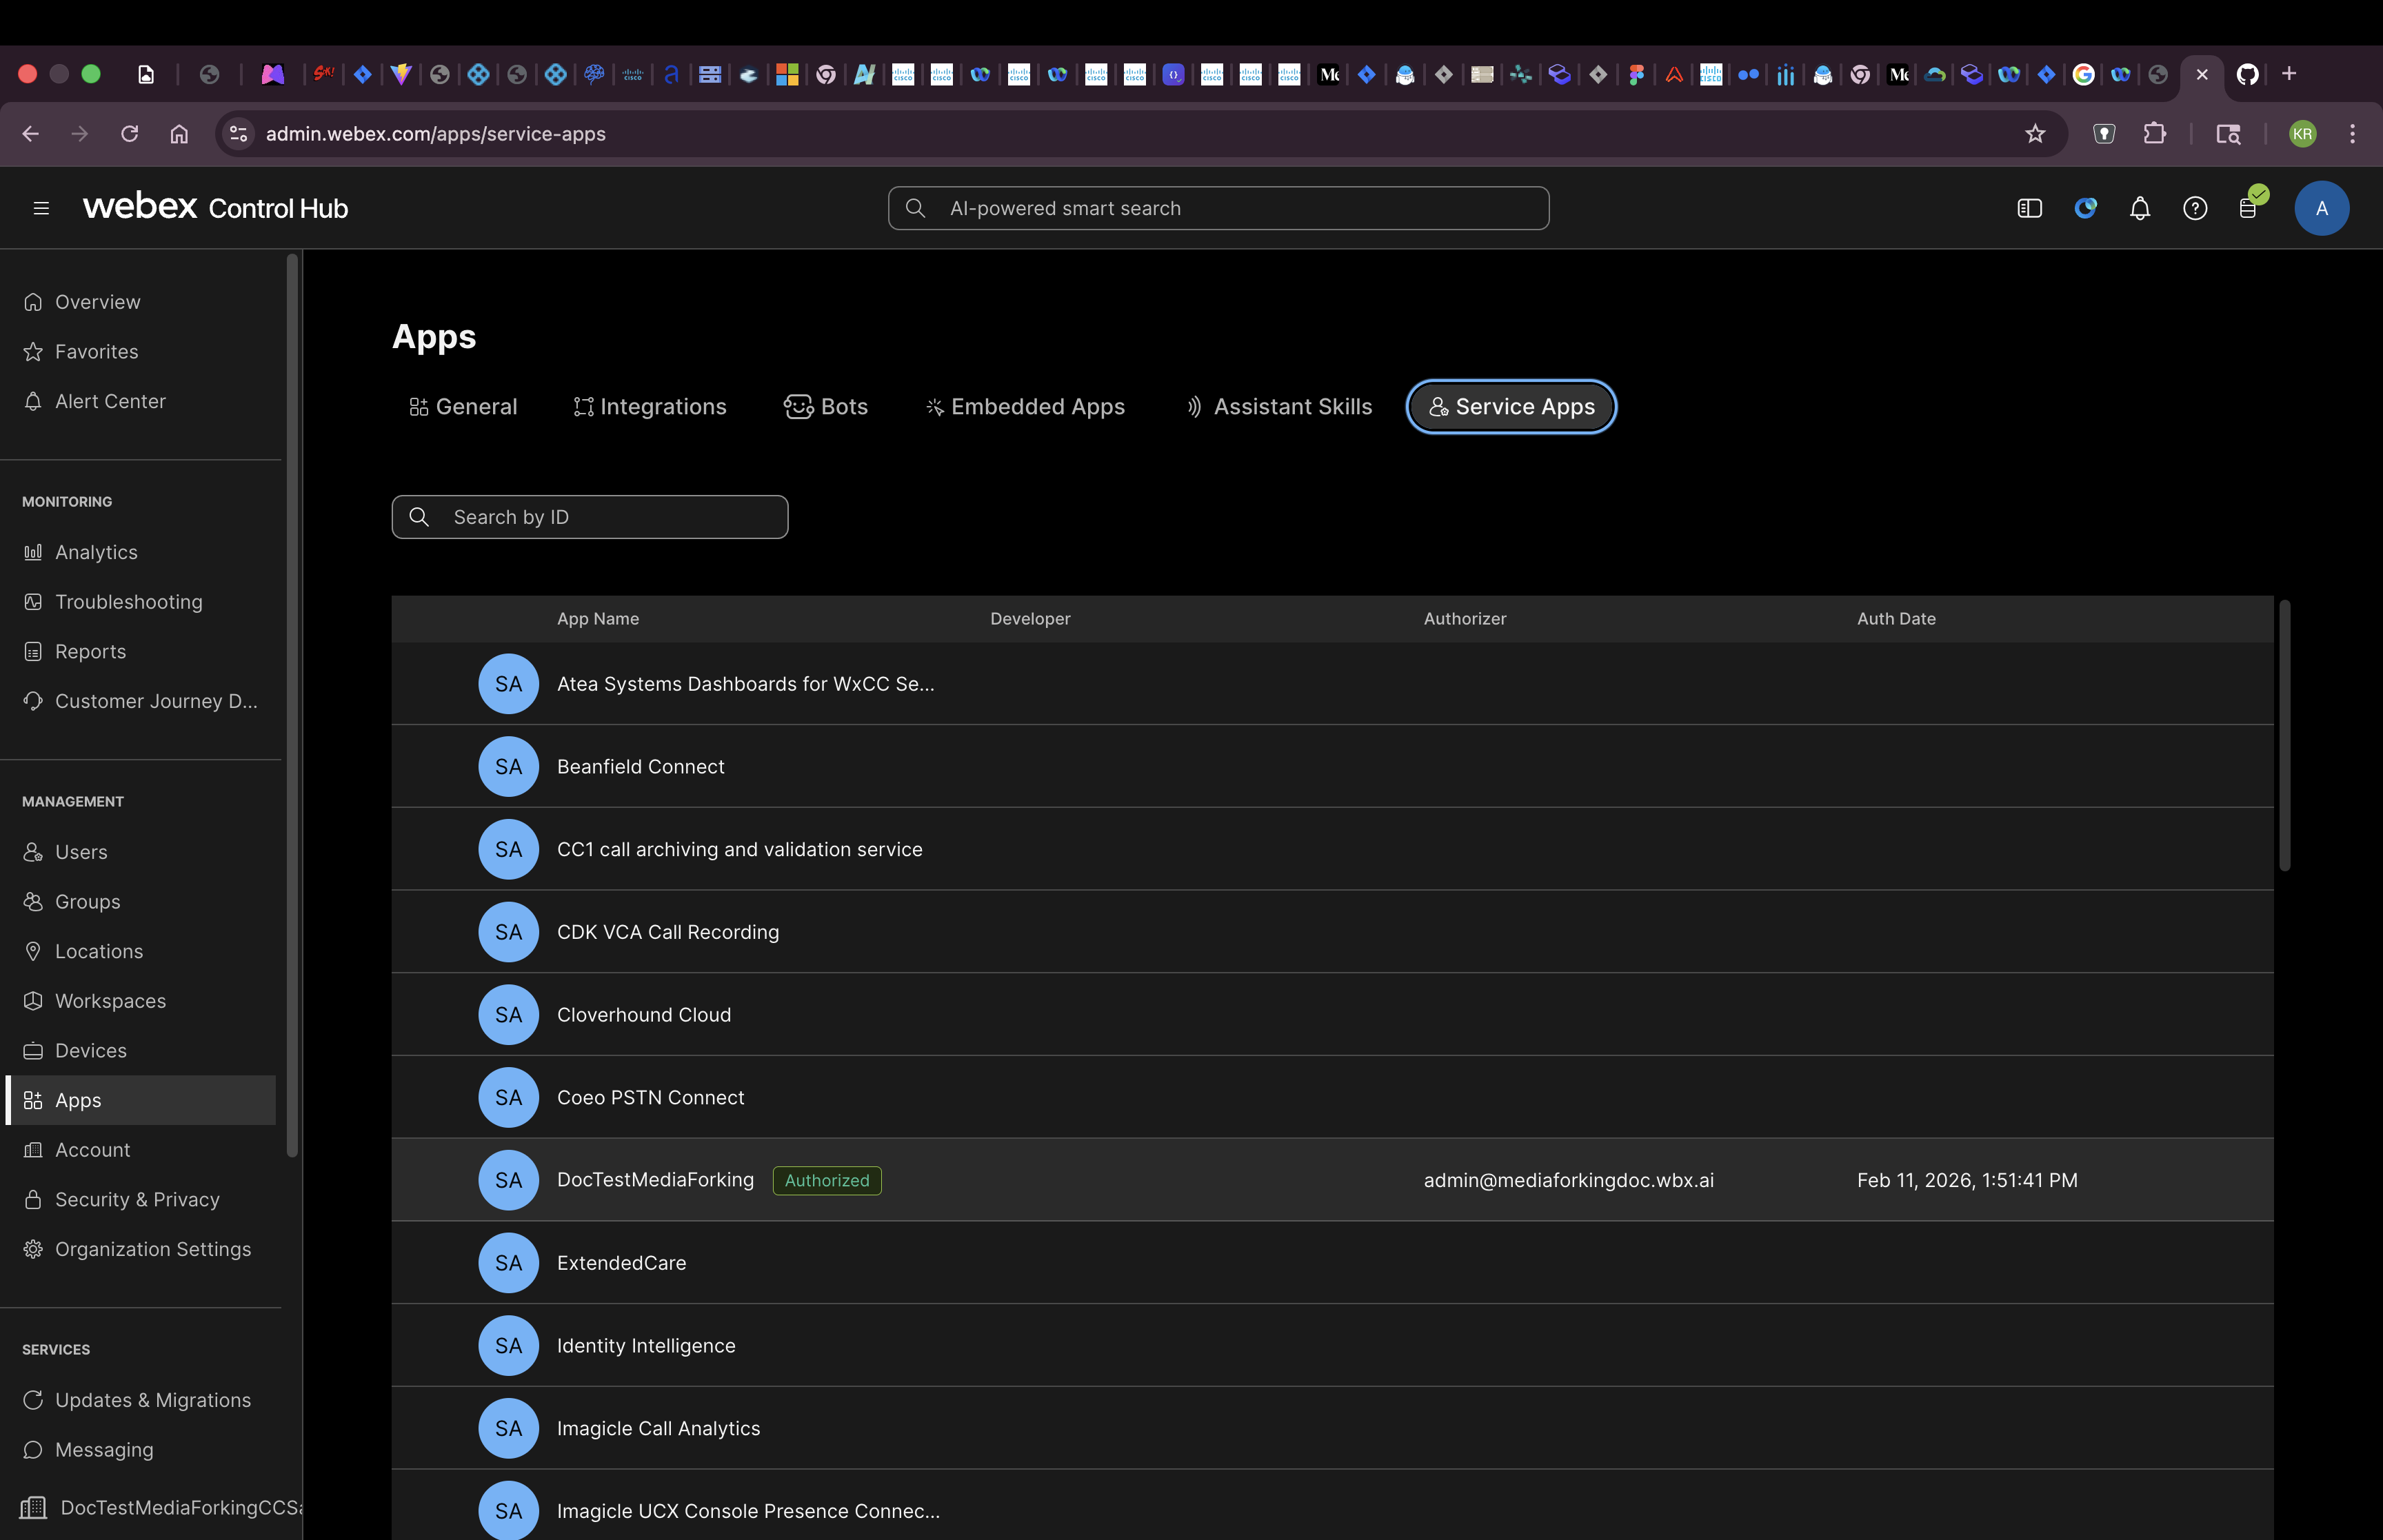 Service App shown as authorized in Control Hub under Apps → Service Apps
Step 4: Retrieve Organization-Specific Tokens
Tool: Webex Developer Portal or API
After a customer admin authorizes your Service App, you need to retrieve access and refresh tokens specific to that organization.
Option A: Via Developer Portal (Manual)
- Go to your Service App details page in the Developer Portal
- Scroll to “Org Authorizations” section
- Select the organization from the dropdown
- Organizations are identified by their base64-encoded Org ID
- Format:
Y2lzY29zcGFyazovL3VzL09SR0FOSVpBVElPTi8...
- Enter your Client Secret
- Click “Get Tokens”
- Copy and securely store:
- Access Token: Used for API calls (expires in ~14 days)
- Refresh Token: Used to get new access tokens (expires in ~90 days)
Option B: Via API (Automated - Recommended)
POST https://webexapis.com/v1/applications/{appId}/token
Authorization: Bearer YOUR_PERSONAL_ACCESS_TOKEN
Content-Type: application/json

{
  "clientId": "YOUR_CLIENT_ID",
  "clientSecret": "YOUR_CLIENT_SECRET",
  "targetOrgId": "Y2lzY29zcGFyazovL3VzL09SR0FOSVpBVElPTi8..."
}
Response:
{
  "access_token": "ZmI0ZjYwNzktYzBjMi00NGE1LWEwMjYtZGU3MDUzZjk5YzRm...",
  "refresh_token": "MDM4NzYwNmItZjBhYi00YTQ5LWE1ZjItZGU3MDUzZjk5YzRm...",
  "token_type": "Bearer",
  "expires_in": 1209600
}
Important: Store these tokens securely! You’ll use them to register the data source.
Step 5: Register Your Data Source
Tool: Webex Data Sources API
Now register your gRPC endpoint as a data source (more accurately, a data sink) for this specific customer organization.
Why “Data Source”?
The API is called “data sources” because it’s a generic API used for multiple use cases. For media forking specifically, this is actually a data sink - the destination where media is sent. Each customer organization gets its own data source registration, allowing independent management per customer.
Register the Data Source
API Reference: Register a Data Source
POST https://webexapis.com/v1/dataSources
Authorization: Bearer SERVICE_APP_ACCESS_TOKEN_FOR_THIS_ORG
Content-Type: application/json

{
  "schemaId": "YOUR_MEDIA_FORKING_SCHEMA_ID",
  "url": "https://media-forking-customer-xyz.acme.com:8086",
  "audience": "MediaForkingService",
  "subject": "callAudioData",
  "nonce": "YOUR_RANDOM_NONCE_STRING",
  "tokenLifeMinutes": 720
}
Parameter Details:
- schemaId: The UUID of the media forking schema (obtained from Service App creation or
/v1/dataSources/schemasAPI)- Example:
78efc775-dccb-45ca-9acf-989a4a59f788
- Example:
- url: Your gRPC endpoint URL - must match or be a subdomain/path of the Data Exchange Domain specified in your Service App
- ✅ Service App domain:
acme.com→ Data source:https://media-forking-customer-xyz.acme.com:8086 - ✅ Service App domain:
acme.com→ Data source:https://acme.com/customer-xyz:8086 - ❌ Service App domain:
acme.com→ Data source:https://different.com:8086(will be rejected)
- ✅ Service App domain:
- audience: Identifier for your service (used in JWS token validation)
- subject: Purpose of the data exchange (e.g., “callAudioData”)
- nonce: Random string used to prevent replay attacks - update regularly when refreshing the data source
- tokenLifeMinutes: Token lifetime in minutes (minimum: 60, maximum: 1440 = 24 hours)
- Recommended: 720 minutes (12 hours)
Important Notes:
- Per-Organization: Register a separate data source for each customer organization
- Token Refresh: The data source must be updated (PATCH) before the token expires to maintain service
- JWS Authentication: Webex constructs JWS tokens using these parameters to authenticate with your gRPC endpoint
Response:
{
  "id": "7791dc84-989c-4903-a3b5-8c48c039dfb3",
  "schemaId": "78efc775-dccb-45ca-9acf-989a4a59f788",
  "orgId": "ce861fba-6e2f-49f9-9a84-b354008fac9e",
  "applicationId": "Cc2171594ac633ebec0a22d2af5ff1e44a39539c28838507c3d0de9621d183afe",
  "status": "active",
  "jwsToken": "eyJraWQiOiIxOWFmMzYxYS0zYWI0LTU0NzEtYTViMC03MmQxODQyOTRjMmYi...",
  "tokenExpiryTime": "2024-10-31T02:13:25.776Z",
  "nonce": "YOUR_RANDOM_NONCE_STRING",
  "createdBy": "1a034299-8e07-49a9-b147-a4b86999b96c",
  "createdAt": "2024-10-31T01:13:25.780Z",
  "url": "https://media-forking-customer-xyz.acme.com:8086"
}
Save the dataSource-id for your records.
⚠️ CRITICAL: Data Source Must Be Refreshed Regularly
Your data source registration must be updated at least every 24 hours to prevent expiration. Many developers have experienced issues because their data source expired.
Best Practice:
- Update your data source every 12 hours (minimum 1 hour, maximum 24 hours)
- Set up automated refresh to avoid manual errors
- Monitor expiration times and set alerts
See Step 6 below for detailed token management and refresh procedures.
Step 6: Token Management Strategy
Important: Understand the different tokens involved and their management requirements.
OAuth Tokens (Access & Refresh)
These tokens are used for managing your data source registrations via the Webex APIs.
Token Lifecycle:
- Access Token: Expires in 14 days
- Refresh Token: Expires in 90 days, but expiration extends each time it’s used
- Standard OAuth behavior: As long as you use the refresh token, it remains valid
When to Refresh:
- Refresh the access token before it expires (recommend: when < 1 day remaining)
- Use the refresh token to get a new access/refresh token pair
- Both tokens are replaced when you refresh
Refresh OAuth Access Token:
POST https://webexapis.com/v1/access_token
Content-Type: application/x-www-form-urlencoded

grant_type=refresh_token
&client_id=YOUR_CLIENT_ID
&client_secret=YOUR_CLIENT_SECRET
&refresh_token=YOUR_REFRESH_TOKEN
Response:
{
  "access_token": "NEW_ACCESS_TOKEN",
  "refresh_token": "NEW_REFRESH_TOKEN",
  "token_type": "Bearer",
  "expires_in": 1209600
}
Important: Both tokens are refreshed - store the new tokens and discard the old ones.
JWS Token (Runtime Authentication)
The JWS token is used by WXCC to authenticate with your gRPC server at runtime when streaming media.
How It Works:
- You register a data source with authentication details (public key, nonce, expiration)
- When a call triggers media forking, WXCC constructs a JWS token using your authentication details
- WXCC sends the JWS token to your gRPC server
- Your server validates the token using your private key
JWS Token Requirements:
- Maximum lifetime: 24 hours
- Update frequency: Between 1 hour (minimum) and 24 hours (maximum)
- Best practice: Update every 12 hours
How to Update JWS Token Info:
Update your data source registration with new nonce and expiration:
PATCH https://webexapis.com/v1/dataSources/{dataSourceId}
Authorization: Bearer SERVICE_APP_ACCESS_TOKEN
Content-Type: application/json

{
  "authentication": {
    "type": "JWS",
    "publicKey": "YOUR_PUBLIC_KEY",
    "nonce": "NEW_RANDOM_NONCE",
    "expiration": "2026-01-08T12:00:00Z"  // 24 hours from now
  }
}
Implementation Example:
import time
import secrets
from datetime import datetime, timedelta

class MediaForkingTokenManager:
    def __init__(self, client_id, client_secret):
        self.client_id = client_id
        self.client_secret = client_secret
        self.oauth_tokens = {}  # org_id -> {access_token, refresh_token, expiry}
        self.data_sources = {}  # org_id -> {data_source_id, last_jws_update}

    def refresh_oauth_if_needed(self, org_id):
        """Refresh OAuth access token if expiring soon"""
        token_info = self.oauth_tokens.get(org_id)
        if not token_info:
            return

        # Refresh if token expires in less than 1 day
        if datetime.now() >= token_info['expiry'] - timedelta(days=1):
            self.refresh_oauth_token(org_id)

    def update_jws_token_info(self, org_id):
        """Update data source with new JWS nonce and expiration"""
        ds_info = self.data_sources.get(org_id)
        if not ds_info:
            return

        # Check if we need to update (every 12 hours)
        if datetime.now() >= ds_info['last_jws_update'] + timedelta(hours=12):
            # Generate new nonce
            new_nonce = secrets.token_urlsafe(32)
            new_expiration = datetime.now() + timedelta(hours=24)

            # Update data source via API
            self.update_data_source_auth(org_id, new_nonce, new_expiration)

            # Update tracking
            ds_info['last_jws_update'] = datetime.now()

    def refresh_oauth_token(self, org_id):
        # Call OAuth refresh endpoint
        # Update self.oauth_tokens[org_id] with new tokens
        pass

    def update_data_source_auth(self, org_id, nonce, expiration):
        # Call PATCH /v1/dataSources/{id} endpoint
        # Update authentication.nonce and authentication.expiration
        pass

# Background task: Check and update tokens
while True:
    for org_id in token_manager.oauth_tokens.keys():
        # Refresh OAuth tokens if needed
        token_manager.refresh_oauth_if_needed(org_id)

        # Update JWS token info if needed
        token_manager.update_jws_token_info(org_id)

    time.sleep(3600)  # Check every hour
Step 7: Verify Entry Point and Phone Number
Tool: Control Hub
Who performs this step: Contact Center administrator
Before configuring the flow, verify that you have an entry point with a phone number that routes to a flow.
- Login to Control Hub: https://admin.webex.com
- Navigate to: Contact Center → Customer Experience → Channels
- Check for Inbound Telephony Channel:
- You should see an “Inbound Telephony” channel listed
- This channel has an entry point associated with it
- The entry point should point to a flow (e.g.,
BasicQueueFlow)
- Note the Phone Number:
- At the bottom of the channel configuration page, you’ll see the phone number
- Save this number - you’ll use it to test your media forking integration
- Example:
+1-555-123-4567
- Verify Flow Assignment:
- Confirm the entry point is assigned to
BasicQueueFlow(or your target flow) - If not assigned, select the flow from the dropdown
- Confirm the entry point is assigned to
Step 8: Modify BasicQueueFlow with Media Forking
Tool: Flow Designer (Control Hub)
Who performs this step: Contact Center administrator
Now configure the flow to trigger media forking when an agent answers a call.
Navigate to Flow Designer
- Login to Control Hub: https://admin.webex.com
- Navigate to: Contact Center → Flows
- Find BasicQueueFlow in the list
- Click to open the flow
Understand the Flow Structure
When you open BasicQueueFlow, you’ll see two tabs:
- Main flow: The primary call flow (IVR, queue, etc.)
- Event flows: Handlers for specific events (agent answered, agent disconnected, etc.)
The Main flow shows:
- A message is played to the caller
- The call is placed into a telephony queue
- The call waits for an agent
We need to add media forking to the Event flows tab, specifically after the agent answers.
Configure Event Flows
-
Click the “Event flows” tab at the top of the Flow Designer
- Before configuration, the Event flows tab shows default event handlers:
AgentAnswered- Triggered when agent picks up the callPhoneContactEnded- Triggered when call endsAgentDisconnected- Triggered when agent disconnectsOnGlobalError- Error handlerAgentOffered- Triggered when call is offered to agentPreDial- Before dialing
-
Click on the
AgentAnsweredevent handler to expand it - Add the Start Media Stream activity:
- From the left sidebar, find “Start Media Stream” activity
- Drag it into the
AgentAnsweredevent flow - Place it as the first activity after the event trigger
- Connect the flow:
- Connect
AgentAnsweredevent →Start Media Streamactivity - Connect
Start Media Stream→Disconnect Contact(on failure path) - The success path continues the call normally
- Connect
- Configure Error Handling (optional):
- Add error handling for the “Failure” output of Start Media Stream
- You can choose to disconnect the call or continue without media forking
After Configuration
Your Event flows should now look like:
AgentAnswered→StartMediaStream→ (success continues call) / (failure →DisconnectContact)
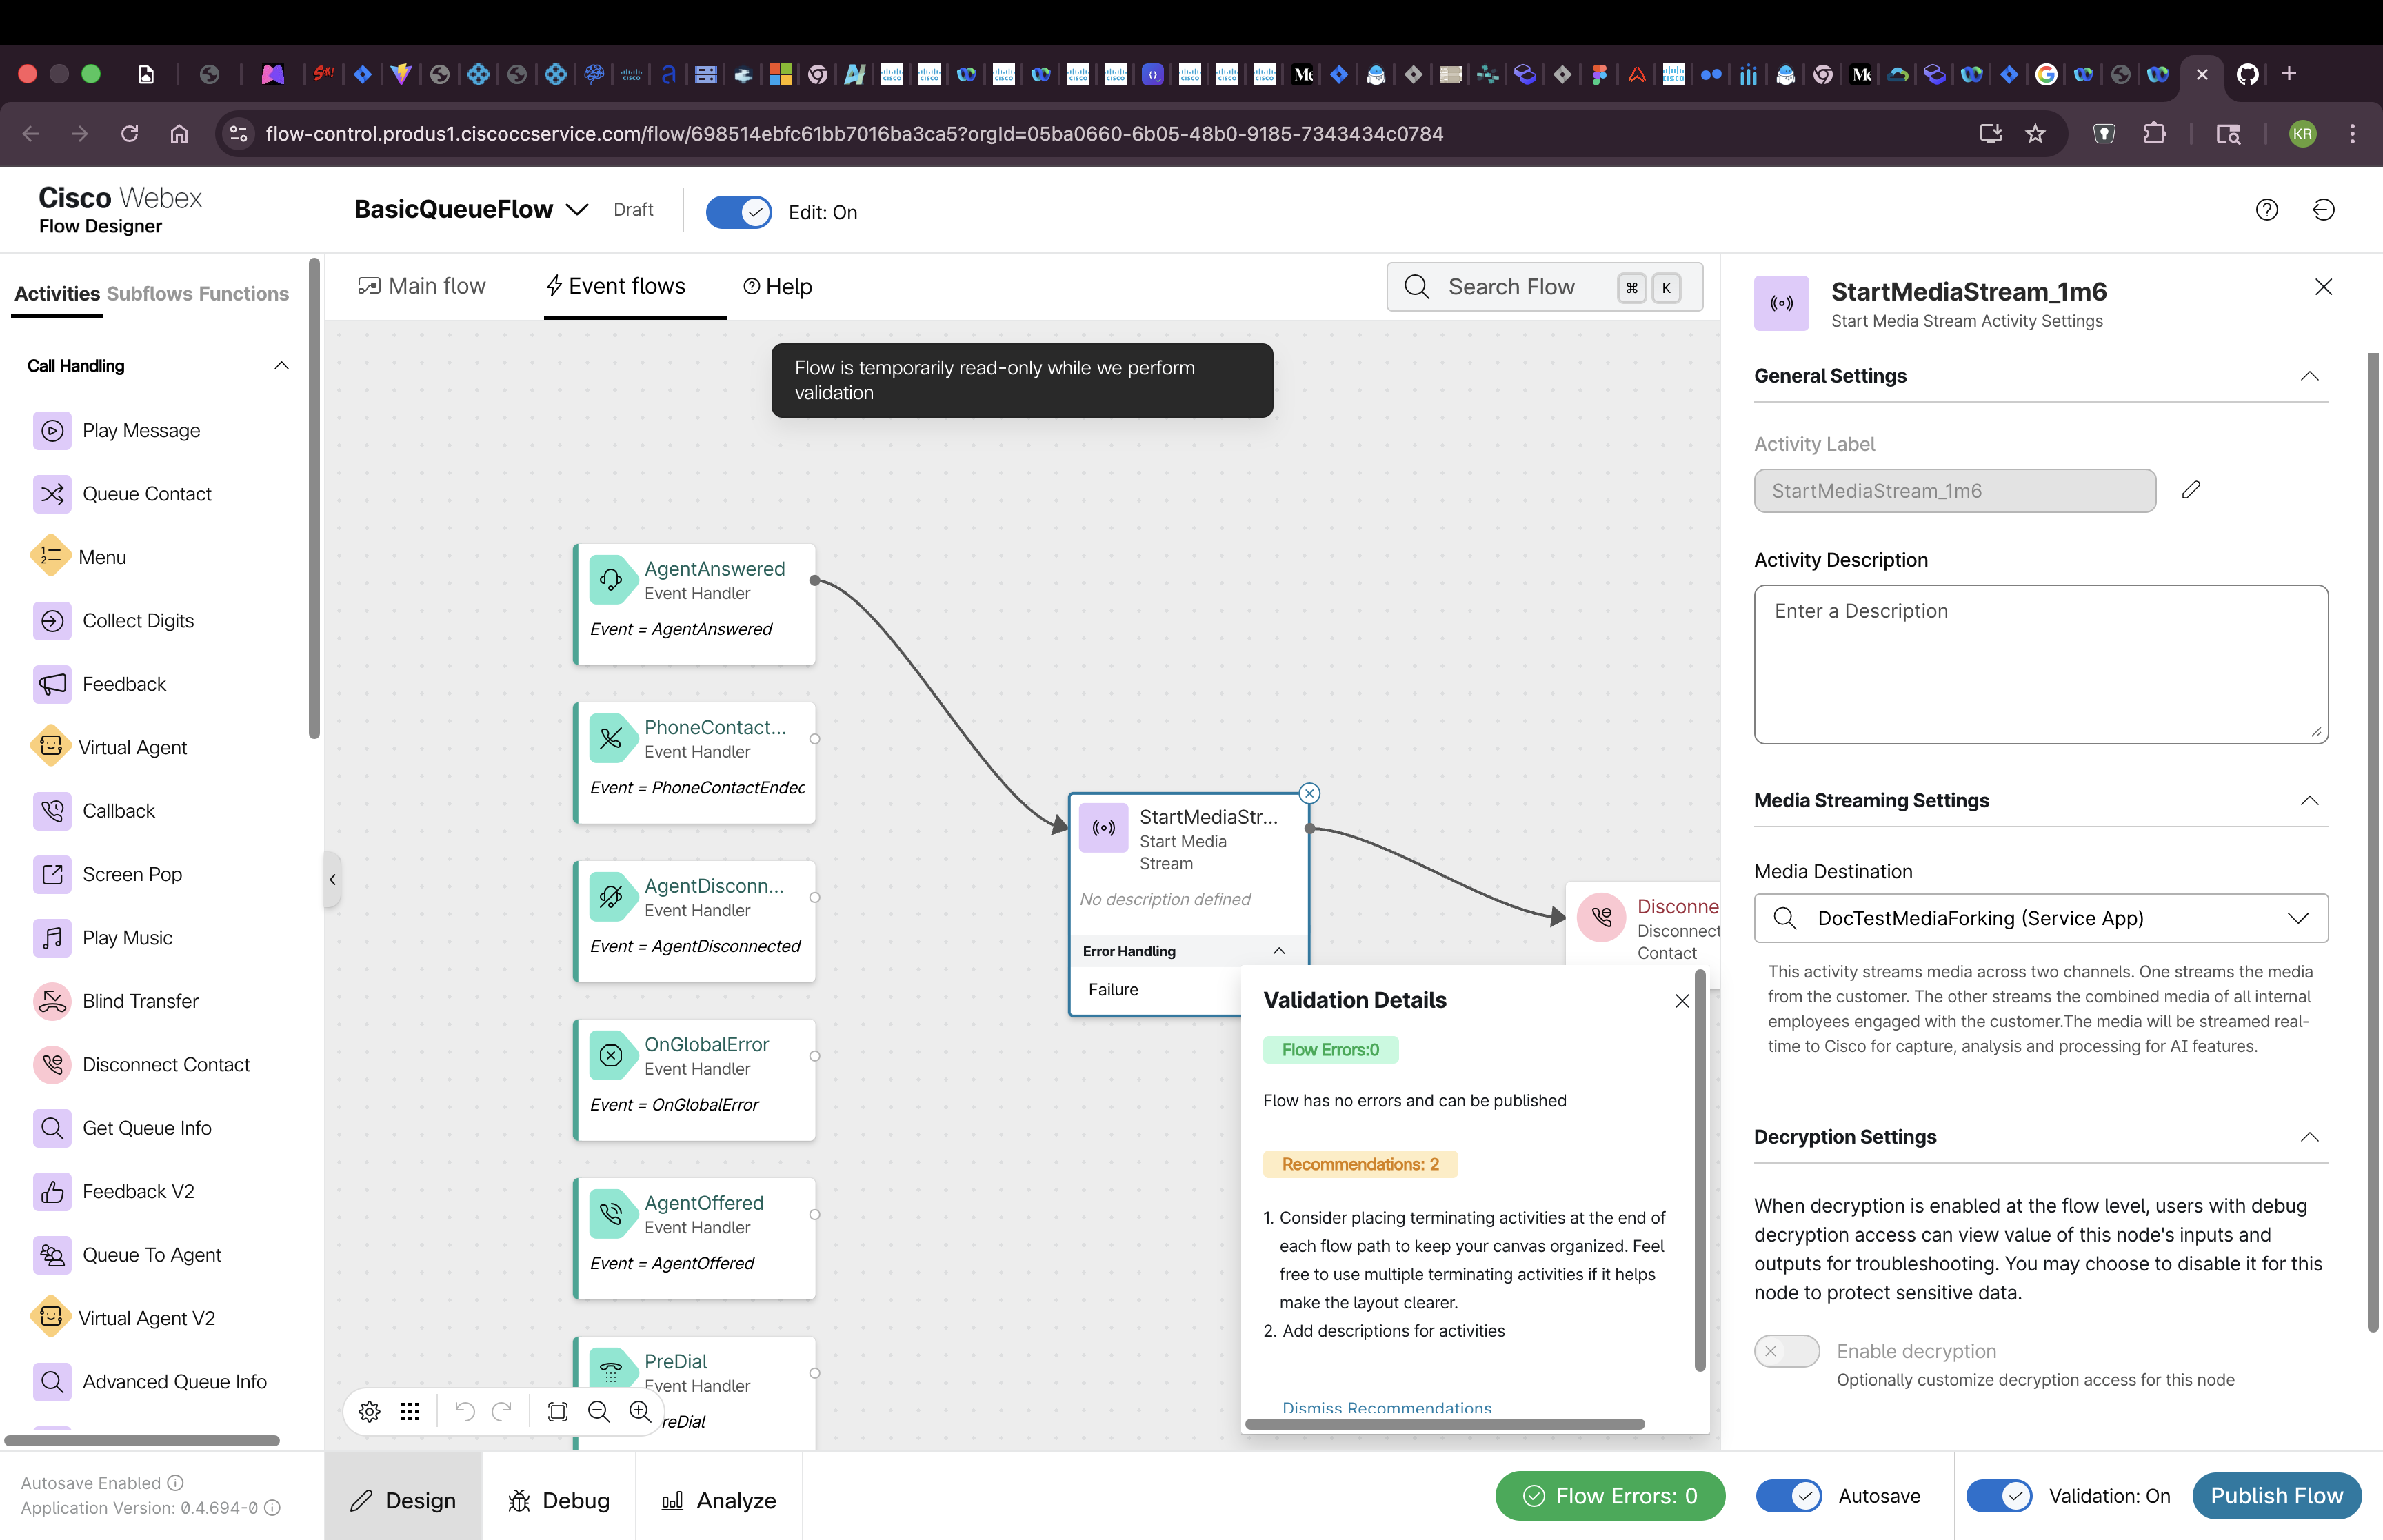 Event flows tab showing Start Media Stream configured in the AgentAnswered event
Configure the Start Media Stream Activity
When you add the Start Media Stream activity to the flow, you’ll need to configure it:
- Select the Service App:
- Click on the Start Media Stream activity to open its configuration
- You’ll see a dropdown to select a Service App
- Choose the Service App you authorized in Step 3
- This creates a reference to your Service App in the flow state
How the Flow State Connects to Your Data Source:
The flow state stores a reference to your Service App. This reference is critical for runtime operation:
- Flow State → Contains Service App reference
- Service App → Associated with your organization
- Organization → Has a registered data source (from Step 5)
- Data Source → Contains your gRPC endpoint URL and authentication details
At runtime, the Orchestrator uses this chain of references to:
- Look up which data source is registered for this organization
- Retrieve your gRPC endpoint URL from the data source
- Retrieve your authentication details (public key, nonce, expiration)
- Generate a JWS token using those authentication details
- Connect to your gRPC server at the specified URL
- Authenticate using the generated JWS token
This architecture allows each customer organization to have its own data source configuration while using the same Service App.
Validate and Publish
- Click “Validate” to check for errors
- Fix any validation errors
- Click “Publish” to make the flow live
- Confirm the publish action
What Happens at Runtime:
When a call comes in and an agent answers:
- The
AgentAnsweredevent is triggered - The
Start Media Streamactivity executes - WXCC Orchestrator reads the Service App reference from the flow state
- Orchestrator looks up the data source URL registered for this organization
- Orchestrator retrieves authentication details from the data source registration
- Orchestrator constructs a JWS token using your public key, nonce, and expiration
- Orchestrator establishes a gRPC connection to your endpoint URL
- Orchestrator authenticates with the JWS token
- Audio streams (customer and agent channels) are sent to your gRPC server in real-time
Step 9: Agent Login to Agent Desktop
Tool: Webex Contact Center Agent Desktop
Who performs this step: Contact Center agent
Before testing, an agent must be logged in and available to receive calls.
Agent Desktop Login
- Navigate to Agent Desktop:
- For US datacenter sandboxes: https://desktop.wxcc-us1.cisco.com/
- For other datacenters, use the appropriate regional URL
- Login with Agent Credentials:
- Use one of the pre-provisioned agent accounts from your sandbox
- Or use your own agent credentials if testing in your organization
- Select Team and Dial Number (if required):
- Choose the appropriate team from the dropdown
- Enter your dial number if prompted (for outbound calling)
- Set Status to Available:
- After logging in, the agent status defaults to “Idle” or “Not Ready”
- Click the status dropdown
- Select “Available” to start receiving calls
- The agent is now ready to accept incoming calls
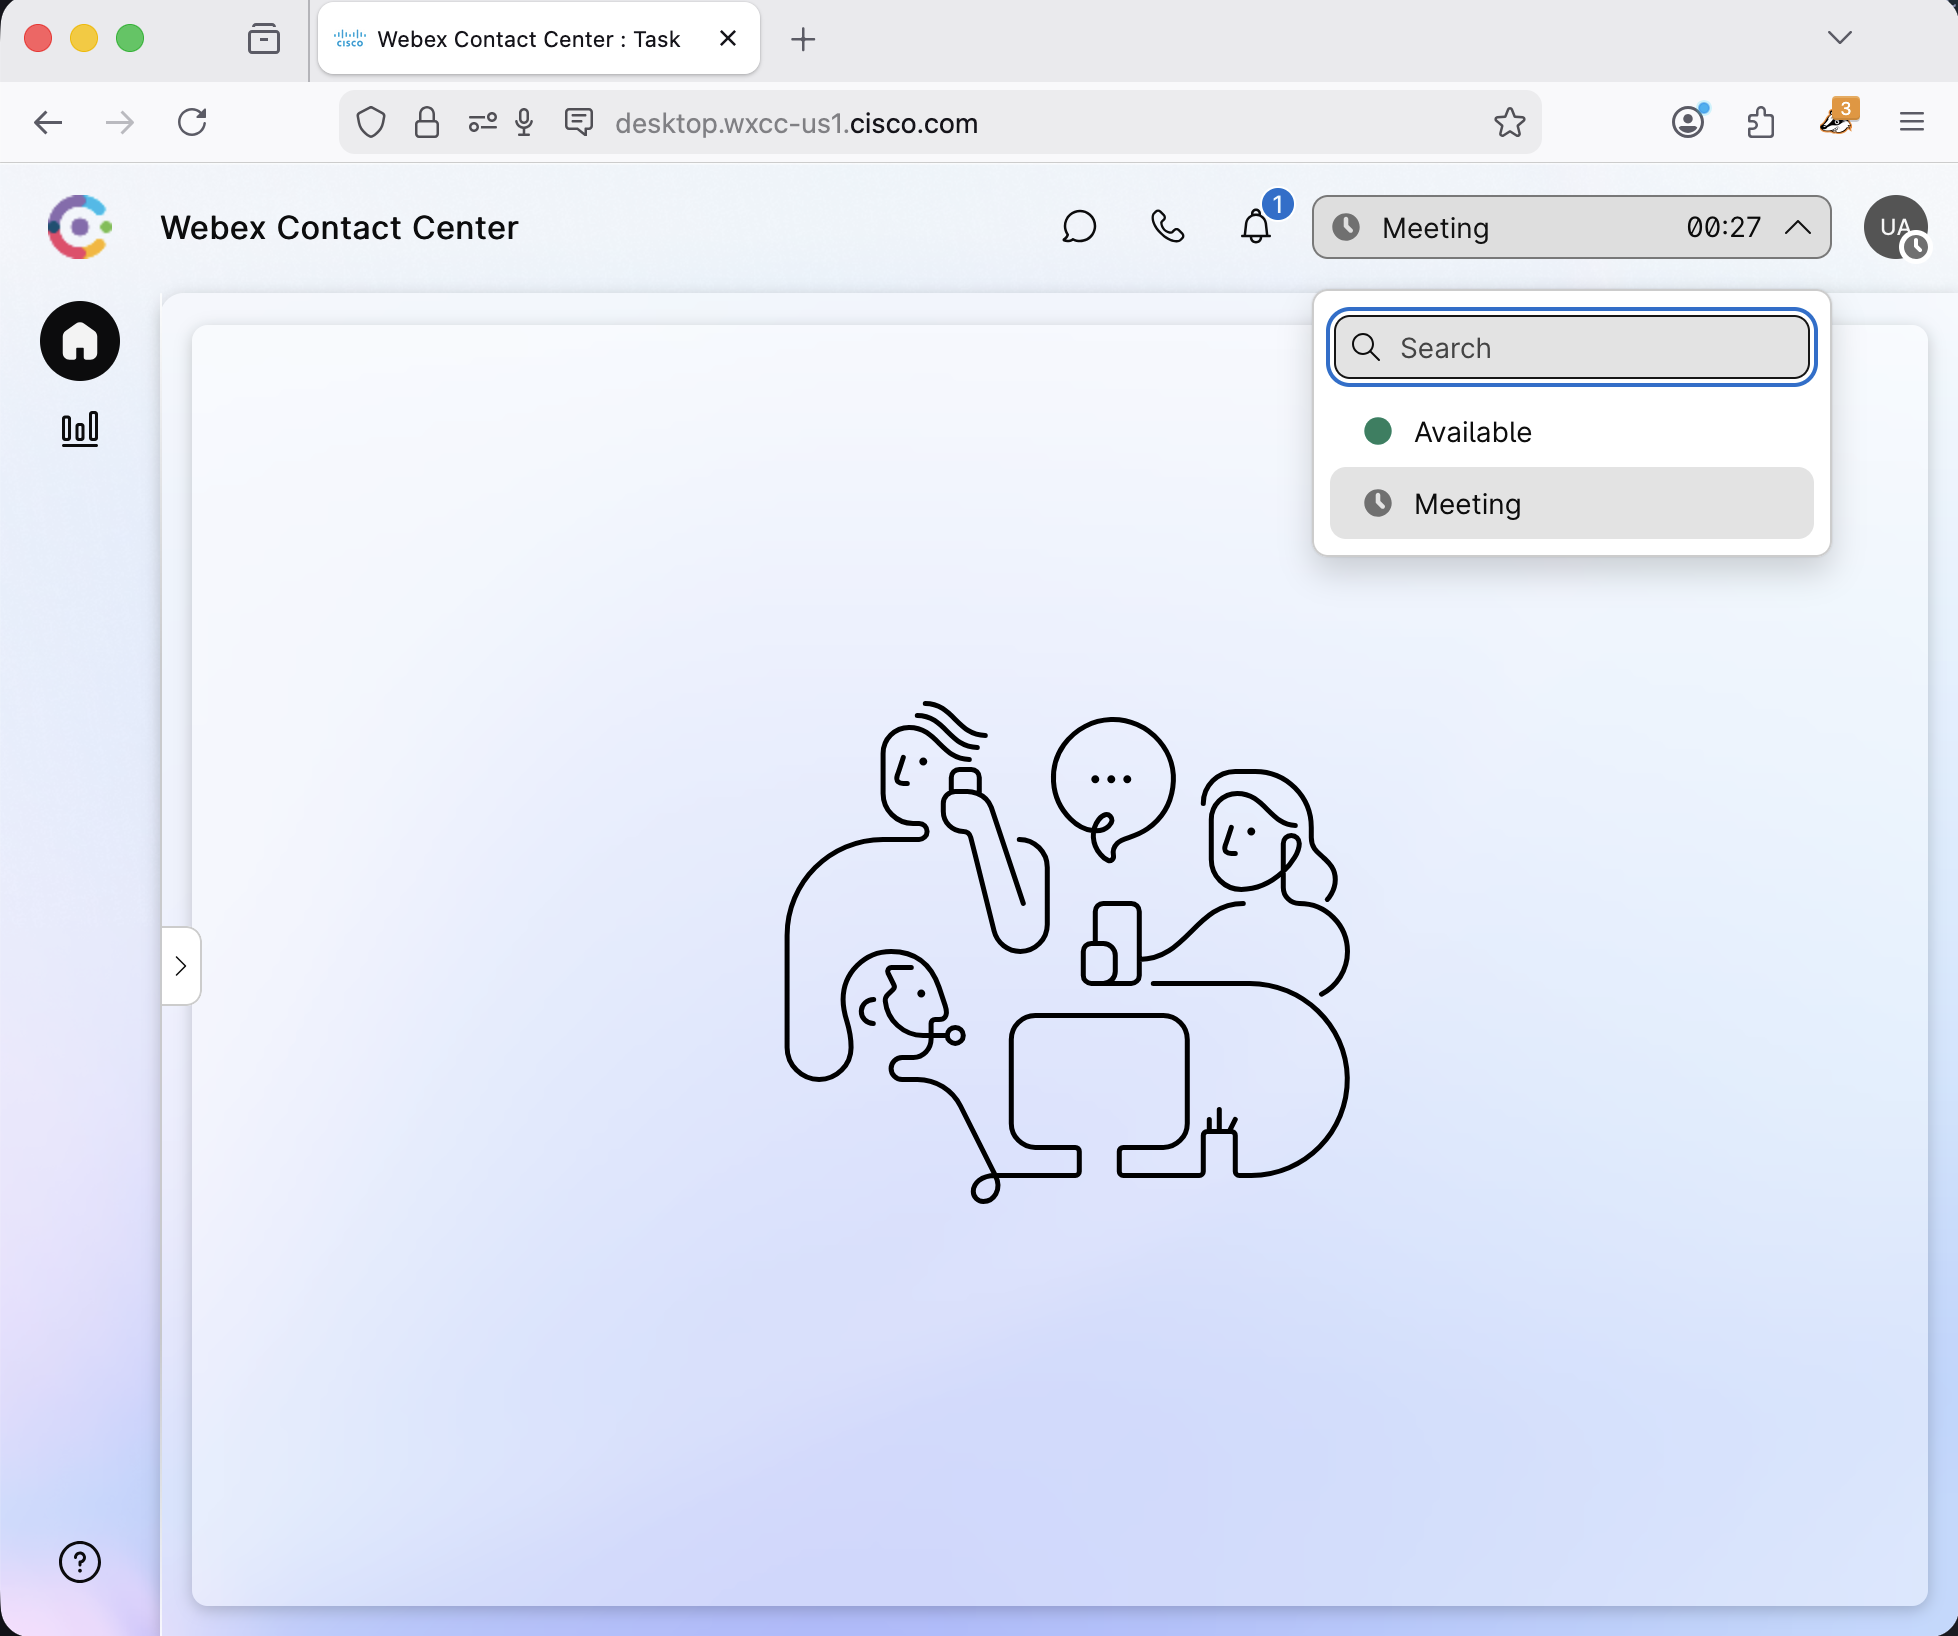 Agent Desktop showing logged-in agent with Available status
Important Notes:
- The agent must be in Available status to receive calls
- If no agents are available, calls will queue indefinitely
- Media forking only triggers when an agent answers the call
Testing Your Integration
Test Checklist
Before making a test call, verify all configuration steps are complete:
- Sandbox Provisioned: Contact Center sandbox is active (or using your own org)
- Feature Toggles Enabled: Media forking feature toggles enabled by Product Manager
- Simulator Running: Verify your gRPC server is running and accessible
- Health Check: Confirm health endpoint responds correctly (
grpcurltest passes) - Service App Created: Service App created with Media Forking schema and correct scopes
- Service App Authorized: Admin has authorized the Service App in Control Hub
- OAuth Tokens Retrieved: Access and refresh tokens obtained for the organization
- Data Source Registered: Data source registered via API and active
- Data Source Refresh Scheduled: Automated refresh set up (every 12 hours)
- Entry Point Verified: Entry point exists with phone number assigned
- Flow Modified: BasicQueueFlow updated with Start Media Stream in AgentAnswered event
- Flow Published: Modified flow validated and published
- Agent Logged In: Agent logged into Agent Desktop and set to Available status
Making a Test Call
- Call your Entry Point (contact center phone number)
- Navigate through IVR (if applicable)
- Request to speak with an agent
- Wait for agent connection
- Media forking should trigger when agent answers
Monitoring the Simulator
Watch the simulator logs for incoming connections:
# Simulator logs should show:
INFO: Received gRPC connection from WXCC
INFO: Session started - conversationId: conv-12345
INFO: Receiving audio stream - Channel 1 (Customer)
INFO: Receiving audio stream - Channel 2 (Agent)
INFO: Audio chunk received - 320 bytes
INFO: Audio chunk received - 320 bytes
...
Verifying Audio Streams
The simulator saves received audio to files:
# Check the output directory
ls -la /tmp/media-forking/

# You should see files like:
# conv-12345-customer.wav
# conv-12345-agent.wav
Play these files to verify audio quality:
# Play customer audio
aplay /tmp/media-forking/conv-12345-customer.wav

# Play agent audio
aplay /tmp/media-forking/conv-12345-agent.wav
Troubleshooting
Common Issues
Issue 1: Simulator Not Receiving Connections
Symptoms:
- No logs showing incoming connections
- WXCC shows “connection failed” errors
Possible Causes & Solutions:
- Endpoint Not Publicly Accessible
# Test connectivity from external network telnet YOUR_PUBLIC_ENDPOINT 8086- Solution: Ensure firewall rules allow incoming connections on port 8086
- Solution: Verify your endpoint is publicly routable (not localhost)
- TLS/SSL Certificate Issues
# Test TLS connection openssl s_client -connect YOUR_PUBLIC_ENDPOINT:8086- Solution: Ensure certificate is valid and not self-signed
- Solution: Verify certificate chain is complete
- Wrong Endpoint in Configuration
- Solution: Double-check the endpoint URL in your data source registration
- Solution: Ensure protocol is
grpc://nothttps://
Issue 2: Audio Quality Issues
Symptoms:
- Audio is choppy or distorted
- Missing audio chunks
Possible Causes & Solutions:
- Network Latency
# Test latency to your endpoint ping YOUR_PUBLIC_ENDPOINT- Solution: Deploy closer to WXCC data centers (US-based recommended)
- Solution: Use a CDN or edge deployment
- Incorrect Audio Format
- Solution: Verify you’re handling LINEAR16 or μ-law encoding
- Solution: Confirm sample rate is 8kHz or 16kHz
- Solution: Ensure single-channel audio processing
- Buffer Overflow
- Solution: Increase buffer size in your gRPC server
- Solution: Process audio asynchronously to avoid blocking
Issue 3: Authentication Failures
Symptoms:
- Connection rejected with “authentication failed”
- 401 or 403 errors in logs
Possible Causes & Solutions:
- Invalid JWT Token
- Solution: Regenerate JWT token
- Solution: Verify token hasn’t expired
- Solution: Check token signing algorithm matches expected
- Service App Not Authorized
- Solution: Verify admin has authorized your Service App
- Solution: Check authorization status in Control Hub
Issue 4: Media Forking Not Triggering
Symptoms:
- Call completes but no media streams received
- Flow executes but skips media forking activity
Possible Causes & Solutions:
- Activity Placed Before Agent Connection
- Solution: Move media forking activity to after agent answers
- Solution: Verify flow logic ensures agent connection before forking
- License Not Enabled
- Solution: Verify media forking license is active for the organization
- Solution: Contact Cisco support to confirm license provisioning
- Configuration Not Selected
- Solution: Verify CCAI configuration is selected in the flow activity
- Solution: Confirm configuration status is “active”
Issue 5: High Latency
Symptoms:
- Significant delay between conversation and audio receipt
- Real-time features not working effectively
Possible Causes & Solutions:
- Geographic Distance
- Solution: Deploy your endpoint in the same region as WXCC
- Solution: Use edge computing or regional deployments
- Processing Bottleneck
- Solution: Profile your audio processing pipeline
- Solution: Optimize or parallelize heavy operations
- Solution: Use asynchronous processing
- Network Congestion
- Solution: Monitor network metrics
- Solution: Implement QoS (Quality of Service) policies
- Solution: Use dedicated network connections
Debug Mode
Enable detailed logging in the simulator:
# application.properties
logging.level.root=DEBUG
logging.level.com.cisco.wccai=TRACE
logging.level.io.grpc=DEBUG

# Log all gRPC messages
grpc.server.enableReflection=true
grpc.server.logRequests=true
grpc.server.logResponses=true
Testing Tools
grpcurl - Test gRPC Endpoints
# List available services
grpcurl -plaintext YOUR_ENDPOINT:8086 list

# Call health check
grpcurl -plaintext YOUR_ENDPOINT:8086 com.cisco.wcc.ccai.v1.Health/Check

# Test with reflection
grpcurl -plaintext YOUR_ENDPOINT:8086 describe
Wireshark - Capture gRPC Traffic
# Capture on gRPC port
sudo tcpdump -i any -w grpc-capture.pcap port 8086

# Open in Wireshark and filter:
# tcp.port == 8086
Getting Help
If you’re still experiencing issues:
- Check Simulator Logs: Review detailed logs for error messages
- Verify Configuration: Double-check all configuration steps
- Test Connectivity: Use tools like
telnet,grpcurl,openssl - Contact Support: Reach out to Cisco support with:
- Organization ID
- Configuration ID
- Conversation ID (from failed call)
- Simulator logs
- Network diagnostics
Next Steps
Congratulations! You now have a working media forking setup with the simulator. Here’s what to do next:
1. Understand the gRPC Protocol
Next Document: Media Forking gRPC Protocol Reference
This document will cover:
- Detailed protocol buffer definitions
- Message types and sequences
- Bidirectional streaming patterns
- Error handling and retries
- Best practices for production implementations
2. Build Your Production Solution
Replace the simulator with your production implementation:
- Speech-to-Text: Integrate with Google Speech-to-Text, AWS Transcribe, or Azure Speech Services
- Sentiment Analysis: Add real-time sentiment detection
- Agent Assistance: Build AI-powered agent coaching
- Recording: Implement secure storage and retrieval
- Analytics: Create dashboards and insights
3. Optimize for Production
- Scalability: Design for high-volume concurrent calls
- Reliability: Implement retry logic and failover
- Monitoring: Add metrics, alerts, and observability
- Security: Implement proper authentication and encryption
- Compliance: Ensure PCI-DSS, GDPR, HIPAA compliance as needed
4. Performance Tuning
- Latency Optimization: Minimize end-to-end latency
- Resource Management: Optimize CPU, memory, and network usage
- Load Testing: Test with realistic call volumes
- Auto-Scaling: Implement dynamic scaling based on demand
5. Advanced Features
Explore advanced capabilities:
- Multi-Language Support: Handle conversations in multiple languages
- Speaker Diarization: Identify and separate multiple speakers
- Emotion Detection: Detect emotional states beyond sentiment
- Intent Recognition: Identify customer intent in real-time
- Knowledge Base Integration: Suggest relevant articles to agents
Support & Resources
Documentation
- Webex Contact Center Developer Portal: https://developer.webex.com/webex-contact-center
- Service Apps Guide: https://developer.webex.com/docs/service-apps
- gRPC Documentation: https://grpc.io/docs/
- Protocol Buffers: https://developers.google.com/protocol-buffers
Sample Code
- Enhanced Fork (Recommended): https://github.com/ralfschiffert/webex-contact-center-provider-sample-code
- Official Repository: https://github.com/CiscoDevNet/webex-contact-center-provider-sample-code
- Dialog Connector Simulator:
/media-service-api/dialog-connector-simulator - Protocol Definitions:
/media-service-api/dialog-connector-simulator/src/main/proto
Note: The enhanced fork includes production-ready features for environment variable configuration, improved audio storage, and complete deployment documentation. Use this fork until the enhancements are merged into the official repository.
Getting Help
- Developer Support: ccai-connectors@cisco.com
- Developer Community: https://developer.webex.com/support
- Cisco TAC: For licensed customers with support contracts
Related Guides
Glossary
- Media Forking: Real-time streaming of audio from customer-agent conversations to external systems
- CCAI: Contact Center AI - Cisco’s AI platform for contact centers
- gRPC: High-performance RPC framework used for media streaming
- Media Sink: Your gRPC server endpoint that receives audio streams
- Data Source: Registered endpoint configuration in Webex
- CCAI Configuration: Settings that define which features and endpoints to use
- Flow Designer: Visual tool for creating contact center call flows
- Entry Point: The initial point of contact (phone number, chat, etc.)
- Conversation ID: Unique identifier for each customer-agent conversation
- Dual-Channel Audio: Separate audio streams for customer and agent
Document Version: 1.0
Last Updated: January 7, 2026
Maintained By: Webex Contact Center AI Team
Feedback: ccai-connectors@cisco.com